Category: Volatility
Equity and Bond Volatility are Different – The Need for Broader Thinking
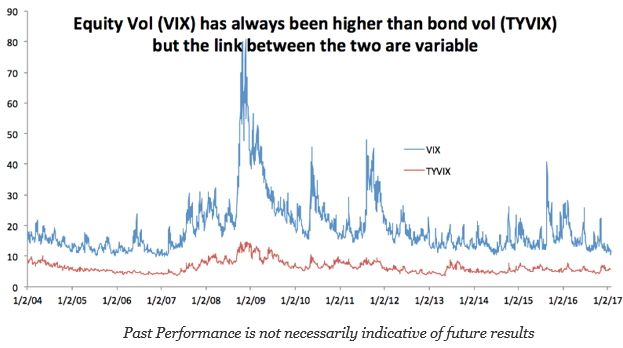
A key issue with asset allocation and risk parity is the changes in volatility across asset classes. The foundation for risk parity is based on equal weighing of asset classes volatility as opposed to setting dollar weighting. Hence, knowing the relative differences in volatility and how they move through time is critical. We can describe some of the key issues associated with any volatility matching or equalization strategy by taking at a quick look at the CBOE VIX index for equity volatility and the TYVIX for Treasury bond volatility. The simple case of comparing these two major assets classes helps to describe the problem of volatility matching.

VVIX vs. VIX – Is something Wrong Here?
The VIX index is an effective measure of volatility expectations. The CBOE VVIX index measures the volatility of volatility for the VIX. If the volatility of volatility is increasing, there should be the expectation that volatility itself should also be increasing. We are seeing that the ratio of the VVIX to VIX is at high levels. Granted the VVIX index is off from recent highs, but the VIX index has continued to move lower even with the heightened policy uncertainty we have discussed in the past with our post on the one chart to look at for the new year.

What are Asset Class Volatility Graphs Telling Us?
A close look at volatility across major asset classes over the last year shows that the BREXIT vote was a much bigger market event than the US presidential election. Looking at stock, bond, and currency volatility over 2016 suggests that the uncertainty post-election has not been as great as the BREXIT shock and already seems to be reversing.
Red Rock Capital – An Honest Update on the Trend Following Landscape
Trend following is the most prevalent strategy utilized throughout the managed futures industry. What is the best way to objectively analyze, measure, and compare the performance of a particular group of trend following CTAs? Last fall we attempted to answer this question by publishing a research paper that introduced our own metric that measures and compares the “goodness” of similar managers’ returns. This article updates that original piece, and the measurements and ranking methodology that we initially introduced remain the same.
Managed Futures – Futures Trends
We know it is early as CTAs are still computing their monthly returns for May. With some early reports and our own proprietary tool Insight, we are seeing gains of >1% for the month of May. With continued downtrend in VIX (at or below 14) many managers trading indexes have been steady but under performing the overall broader S&P 500 index. Whereas managers trading commodities, such as coffee, cocoa, corn, soybeans, wheat, crude…just to name a few have seen a completely different story. Our interpretation is we will see a continued trend in volatility with respect to commodities and continued uptrend in equity indexes (past performance not indicative of future results). That being said, this upward trend in the indexes is going to pull back one of these days. The duration and extent are anyone’s guess. Now is the time to be more aware of “too much of a good thing”. The strength of this bull market for indexes has lasted quite some time.
High vs. low volatility strategies: A different view of risk
When investors think of risk, they usually associate it with volatility. This probably stems from Nobel Prize winning economist Harry Markowitz’s use of volatility in the 1950s and fellow Nobel Prize winner William Sharpe’s use of volatility in creating his self-named method of risk adjusting returns. The lower the volatility of a given investment theoretically indicates that investment carries less risk. Risk, however, could be viewed from a different angle. The impact of a high volatility investment on a portfolio can be mitigated by the allocation size given to that product. By normalizing for volatility, theoretically, high and low volatility investments can have equal impact on a portfolio’s total return. This leads us to a different way to view risk. Risk is the difference between the anticipated worst loss and the realized worst loss.