

In the famous Robert Frost poem “The Road Not Taken,” two paths diverged, and he took the one less traveled. We can look at charts of the US economy and compare them to previous periods to see that so far, we are taking the less traveled path as well. It makes all the difference. Despite a 40-year inflation peak, quickly rising interest rates, and a shrinking Federal Reserve balance sheet, growth is still occurring. Yet, the charts suggest a different story, indicating a possible narrative shift. Perhaps we will continue to walk a new course or shift to the more well-traveled route. Markets do not always follow the expected trajectory, but good investing requires considering all the data.
Seeking Divergence in Data
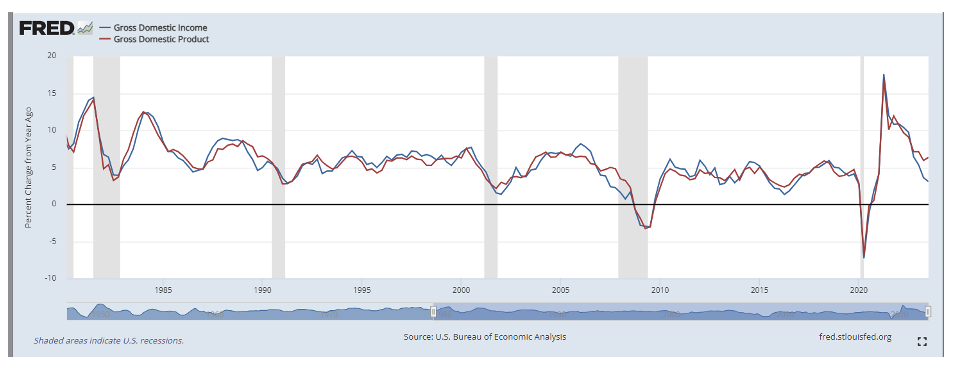
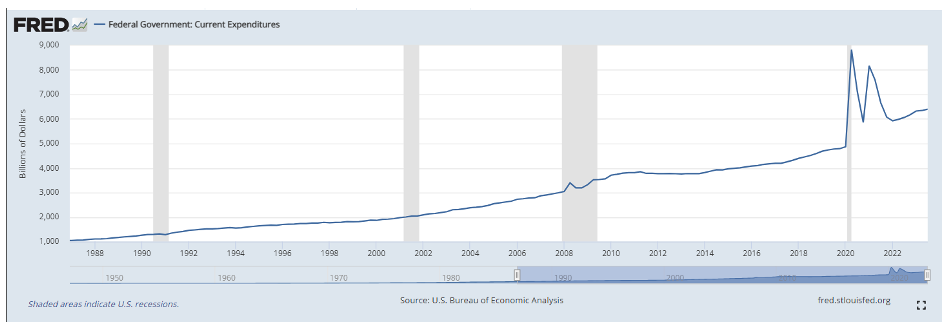
Much like our poet above, I search for divergence when looking at information. This helps me distinguish between what is happening and what “should” happen. The chart below shows the change in gross domestic product (GDP) versus gross domestic income (GDI). In theory, these two should match. GDI measures what the economy takes in by wages, profits, interest, and more. GDP gauges what the economy pumps out in goods, services, and technology. These numbers move in sync back to the 1950s with three notable exceptions: before the 1990 recession, the 2008 crash, and now. Statistical anomalies account for some of this discrepancy, but the more cynical belief is that the GDP numbers might be inflated. Government expenditures may be skewing this data as the budget is a trillion dollars a year more than in 2019.
Global Money Supply (M2) Dynamics
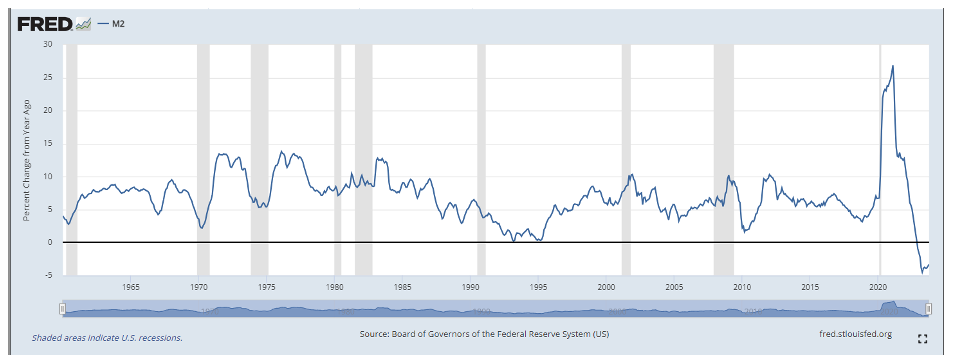
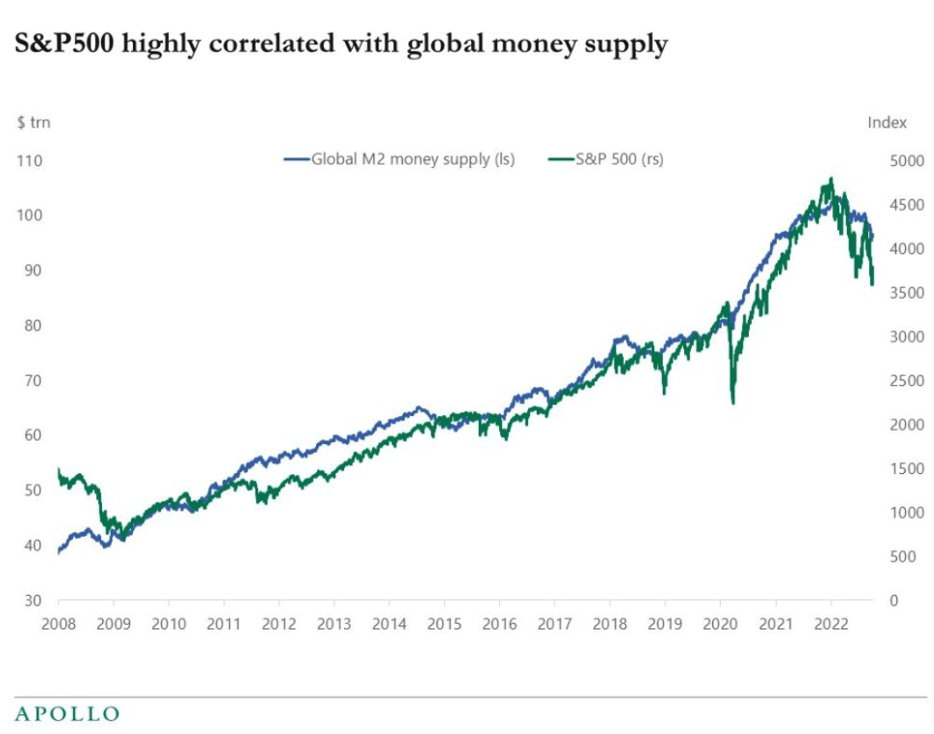
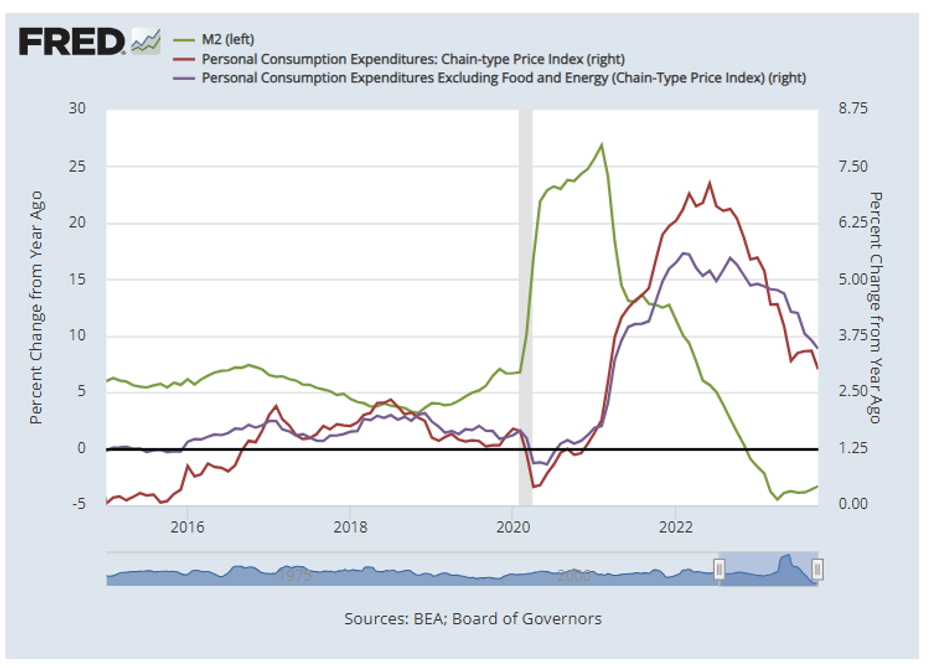
The global money supply or M2 is another metric that highly correlates to the S&P. This number almost always goes up with a few exceptions. It is not difficult to see why inflation occurred, with a 26% yearly spike in circulation by February 2021, followed by a steep drop. This growth rate went negative in December 2022 for the first time since the Great Depression. Professor Jeremy Seigel of Wharton does not think we can have a growing economy without more M2. “Zero percent growth of money supply means unemployment, recession, and deflation,” he says. One could argue that reducing is necessary given the unprecedented flood of money during the pandemic. As with most monetary experiments, we will have to wait and see.
Yield Curve Signals
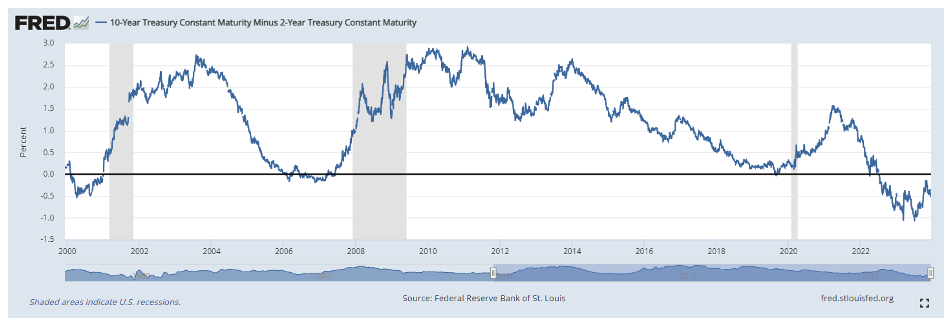
Often, investors look to the yield curve for clues about the future. While improving as of late, the yield curve hit its most inverted point since the early 80’s in June 2023. In simple terms, long-term treasury rates are running below their short-term level. You currently get paid more to loan the government money for two years than you do for ten. Intuitively, this does not make sense, but it displays a belief that despite the assertions of the Fed, investors believe that rates will drop soon. Most periods with inverted yield curves presage a recession, though many do not immediately. Given the recent prominence of government management of the economy, this could mean little or nothing. With a widely expected pause in rate increases, we see some normalization already.
American Consumer Landscape
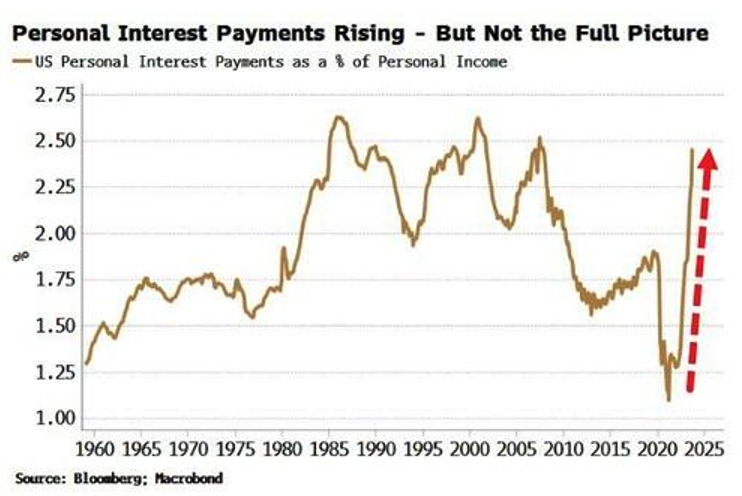
Finally, we look at the American consumer. Transfer payments from the government and lockdown-delayed entertainment expenses contributed to “excess savings” unleashed into the economy after the vaccine rollout. With pandemic stimulus programs expiring, student loan payments back in effect, and interest rates spiking, that solid footing is evaporating quickly. Dropping energy prices brings welcome relief to those struggling but might portend a slowing economy. Bankruptcy filings have increased by 141% since 2022 as long-delayed weakness gets exposed. We predicted this in our article The COVID-19 bankruptcy gap last year. Expect more business failures next year, even if they engineer a soft landing.
Which path our economy will take remains to be seen. Jerome Powell, the Federal Reserve Chair, deserves credit for getting it this far down its unusual path, but 2024 will show us if they completed the job and can avoid recession.
If he does so, it will undoubtedly be the less traveled route.
Sources:
- https://fred.stlouisfed.org/series/M2SL
- https://apolloacademy.com/sp500-vs-m2/
- https://apolloacademy.com/sp500-and-fed-qe-highly-correlated/
- https://fred.stlouisfed.org/series/GDI
- https://research.stlouisfed.org/publications/economic-synopses/2023/05/25/the-rise-and-fall-of-m2
- https://abi.org/newsroom/press-releases/november-commercial-chapter-11-filings-increase-141-percent-over-2022
- https://fred.stlouisfed.org/series/FGEXPND
- https://fred.stlouisfed.org/series/M2SL
- https://www.msn.com/en-us/money/markets/collapsed-us-money-supply-is-a-threat-to-employment-growth-and-inflation-wharton-professor-jeremy-siegel-says/ar-AA1kZ3ur
Photo by Bram Kunnen on Unsplash
Related Posts

Cargo Collapse Chronicles: Navigating the Economic Storm through Freight Industry Signals
Economists often look for the proverbial “canaries in the coal mine” to predict where we head next. Specific areas of the economy tend to presage slowing growth earlier than others. The shipping of materials from one place to another is one such area. A supply chain is either gearing up for future sales or reducing […]

Ag Market Update: Wheat Prices Drop, China Becomes Top Wheat Importer, and Soybean Complex Dynamics
Commentary provided by Chad Burlet of Third Street AG Investments For corn and soybeans, it was a quiet harvest month as far as prices were concerned. Futures contracts for both crops had only 5-7% trading ranges and settled within 1% of where they were a month ago. The U.S. harvest is progressing well, with both crops ahead […]
USDA’s Grain Reports: Wheat Surprises, Corn Holds Steady, and Ethanol Controversy Emerges
Commentary provided by Chad Burlet of Third Street AG Investments The last business day of September always brings us the USDA’s Grain Stocks and Small Grains reports. Traditionally, in these reports, most of the big surprises have been in the corn or soybean stocks, where an unexpected number can trigger a corresponding change in their estimate of […]