In “Bonds – More Than Meets the Eye,” we proposed that despite historically low-interest rates, Treasury Bonds may have opportunities to earn total returns well over their current low yields. In this article, the second installment of a three-part series, we analyze some important factors that help determine where interest rates might be headed in the near term. This article focuses on the demand side of the supply/demand curve to understand pricing pressures. Part 3 of this series will emphasize the supply side of the curve and critical determinants of interest rates, including economic growth and inflation.
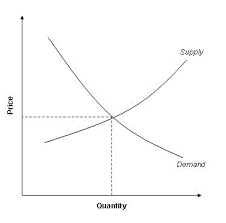
In Economics 101, students are taught that prices for goods are primarily determined by the intersection of the demand and the supply curves, as pictured to the right. The price to borrow
and lend is represented by interest rates and can be analyzed using the same framework. As demand for borrowing increases, the demand curve shifts to the right, and interest rates (again, the price of borrowing) increase. Conversely, when the demand for borrowing falls, the curve turns left, and interest rates decrease.
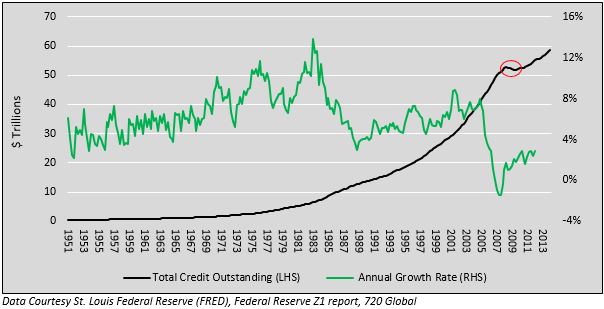
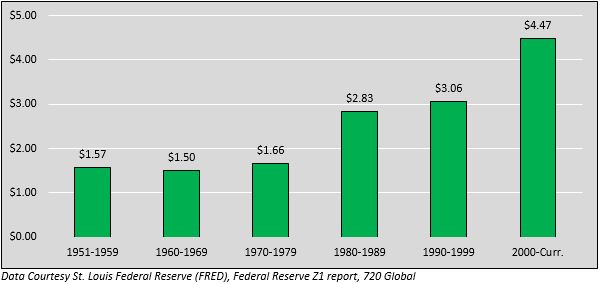
In 1951, the total U.S. credit outstanding (including the government, corporate, and private sectors), as shown in the graph below, was $445 billion and stood at 134% of GDP. Since then, it has grown to nearly $60 trillion and currently stands at over 330% of GDP. The consistently increasing proportion of debt to GDP over this term indicates that the marginal productivity of debt has dropped considerably. In other words, a dollar of credit is not generating economic growth at nearly the pace of years past. As debt (credit) growth outstrips economic growth, the ability to service and ultimately pay off the debt becomes increasingly challenging. The first graph below shows the massive increase in total credit outstanding (black line) and the annual percentage growth of credit outstanding (green line). The second graph shows the increasingly unproductive nature of new debt, as highlighted by the debt required to generate $1 worth of GDP.
Total Credit Outstanding & Growth of Credit Outstanding
Amount of Credit Required to Generate $1 Worth of GDP
In the 1980s, the Federal Reserve became increasingly aggressive in employing below-normal interest rates and de-regulating banking to encourage increased borrowing and stimulate economic growth. As noted earlier, one consequence of the Fed’s action was to promote an increase in debt, which was less productive, thereby providing marginally less economic benefit. Despite the Fed’s intentions, debt and economic growth hit a wall in 2008 when total credit outstanding shrank for the first time since WWII (red circle in the first graph above). Since the great financial crisis, the Fed has used ever more unconventional monetary policy measures to reignite the demand for borrowing. Such measures have included unlimited borrowing authority by banks, a prolonged zero interest rate policy, and trillions of printed dollars through multiple rounds of quantitative easing (QE). The result has been seven years of extraordinarily easy monetary policy and quadrupling the U.S. money supply.
Despite this historic policy, unprecedented actions, and resulting cheap borrowing rates, demand for borrowing remains lethargic. Since 2010, outstanding credit has grown at a 2.5% annualized rate – far from the 6.5% average growth rate of prior decades. Borrower behavior since the crisis of 2008 serves as a warning that the U.S. has limited ability and willingness to borrow. In other words, there are limits on how much one can increasingly borrow more than one’s income. The likely consequence is that the demand curve in the interest rate pricing model may continue to shift to the left, which may likely keep a cap on interest rates.
Related Posts

Systematic vs. Discretionary Trading: Which Strategy Is Right for Your Portfolio?
Investors face many choices when selecting investments. Historically, the main divide was between fundamental and technical trading. The growth of computer systems for trading has introduced a potentially larger variable that will only increase as AI advances, whether in systematic (rules-based) or discretionary (human judgment) trading. In just my 20 years working in the industry, […]

Futures Commission Merchants Explained
New investors to the futures world often ask, “How does opening an account work?” It is a good question. Unlike traditional brokerage accounts, the rules of margin, how trades clear, and the counterparties involved operate differently. A Futures Commission Merchant, typically called by its FCM acronym, is a key player working between all the various […]

Futures Margin Calls, Explained: Initial vs. Maintenance
A margin call is one of the phrases that scares a new futures investor the most. Often, they picture life savings getting wiped out in seconds, as it does in movies. The truth is not nearly as intimidating. Margin is simply a tool. One that educated investors often love. After all, if you expected your […]