
Commentary by John Knott of Numberline Capital Partners.
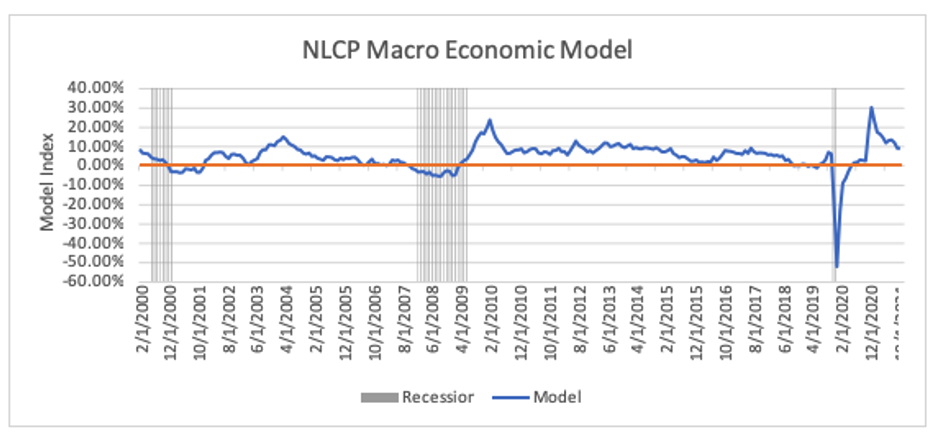
The NLCP Macro-Economic Model up ticked slightly this month from 8.16 to 8.32. That was a little surprising. We expect it to continue to weaken “slowly” as we move into summer and the Fed tries to slow the economy down. There has been a lot of talk about the yield curve inversions daily. It’s one of the inputs in our model. However, it’s useless over the short term. Economies do not go into recessions at full employment. At some point, the labor market has to weaken significantly for that to happen. And we are watching the labor inputs like a hawk. We still have 12 million job openings (a record). We need to burn through those and probably see the unemployment rate get north of 4.5% to begin to worry about a recession.
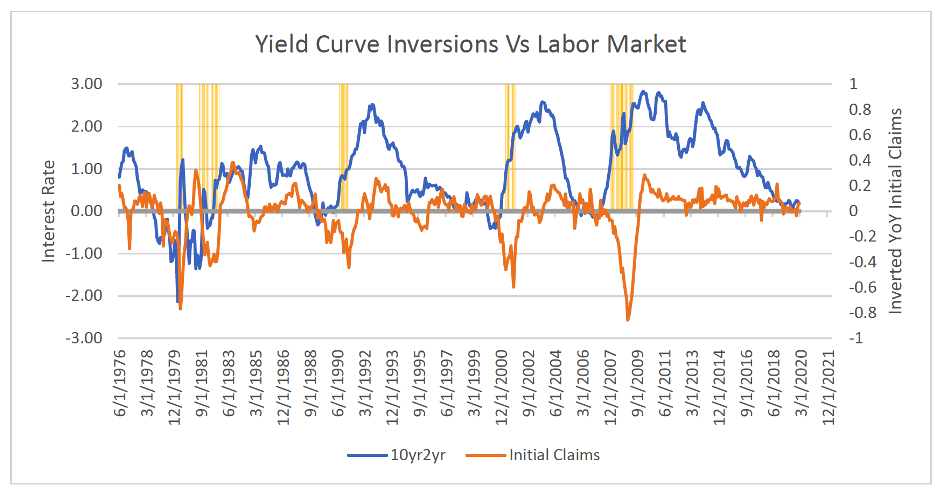
Below is a graph of inversions in the commonly used 10yr/2yr curve. Of course, it’s easy to say a recession is coming eventually. That’s like saying in June in Chicago; it will snow eventually. Timing is important. The graph below shows the 10/2 spread against the year-over-year inverted jobless claims. The shaded areas are the recessions. The avg time to recession is about 15 months after an inversion, but sometimes it can be as long as three years. Two of those times came in 1998 and late 2005. It was not until the job market rolled over that the recession came. Necessary to point out here, that we cut the graph off in Feb 2020, right before Covid. The reason is that the vast moves down and then back up again would have distorted the chart. Currently, the labor market reading on that graph would show plus .70! The highest reading in 46 years where the data started. We believe it’s much more critical to watch labor than the yield curve.
Volatility Outlook
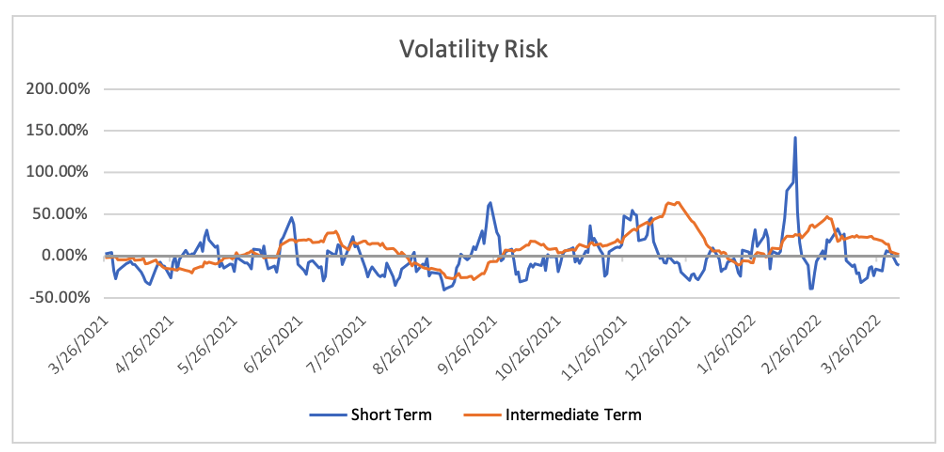
Last month the volatility outlook was concerning. As we have moved through march, both the short-term and long-term vol readings have improved. Despite the Monday selloff, the short-term reading has gone negative again (which is good). And the longer-term outlook is moving down and close to going negative. This sets up well for April because April is historically one of the best months for risk assets. The most volatile input in this model, rates, are still jumping around on Fed talk. This will probably be the case for the next few weeks as the Fed tries to prepare the market for a possible 50 basis point hike at the next meeting. Currency volatility is settling down, and bitcoin volatility is also near 52-week lows, a somewhat surprising development given how volatile the macro landscape is.
Technical Outlook
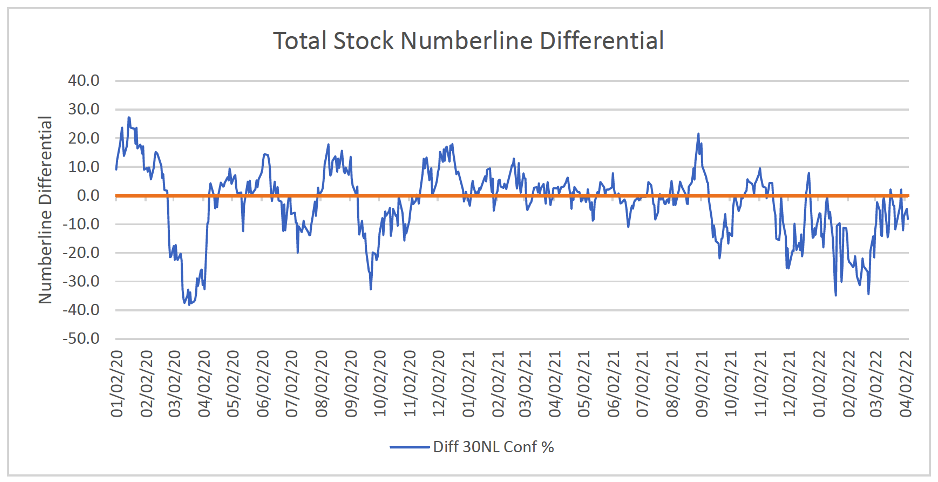
Last month we were encouraged that our total stock numberline differential (a measure that looks at the quantitative scores of 3000 stocks) was getting back to the zero line for the first time in months. And while it has not broken back above zero, it’s not rolling over either. The recent rally off the lows in equities has seen broad-based participation. It’s possible we rollover. But all signs point to a decent bid under the market as we head into earnings season. Remember, this rally off the lows was NOT on good news. The news has done nothing but worsen, both on the war front, the inflation front, and the Fed speak. Yet we see the strength expand. At the very minimum, we are likely range-bound for the time being. And if earnings guidance does not disappoint, we could re-test the highs before summer.
Summary
Last month we left off saying we had 2 out of 3 pieces of the macro landscape in good shape. We had good economic data and improved technicals, but volatility was a concern. We are now closer to 3 out of 3 with the volatility outlook much improved, economic data still very strong and the technical picture holding up. Of course, all this could change tomorrow, but that is why we track the data. Credit spreads started to widen only in the last few weeks for the first time since Covid. And by widen, we’re talking slightly. Looking at the data in front of us, we think it’s likely that a recession is still 18 to 24 months away.
On a side note, we were honored to receive an Investors Choice Award for being one of the best performing CTA programs in 2022 for best multi-strategy funds under 100 million in the Americas. We look to continue to provide consistent risk-adjusted returns going forward through these volatile times.
Past performance is not necessarily indicative of future results.
Photo by Pawel Czerwinski on Unsplash
Related Posts

Navigating Economic Crossroads: A Closer Look at the Unconventional Path
In the famous Robert Frost poem “The Road Not Taken,” two paths diverged, and he took the one less traveled. We can look at charts of the US economy and compare them to previous periods to see that so far, we are taking the less traveled path as well. It makes all the difference. Despite […]

Cargo Collapse Chronicles: Navigating the Economic Storm through Freight Industry Signals
Economists often look for the proverbial “canaries in the coal mine” to predict where we head next. Specific areas of the economy tend to presage slowing growth earlier than others. The shipping of materials from one place to another is one such area. A supply chain is either gearing up for future sales or reducing […]

Ag Market Update: Wheat Prices Drop, China Becomes Top Wheat Importer, and Soybean Complex Dynamics
Commentary provided by Chad Burlet of Third Street AG Investments For corn and soybeans, it was a quiet harvest month as far as prices were concerned. Futures contracts for both crops had only 5-7% trading ranges and settled within 1% of where they were a month ago. The U.S. harvest is progressing well, with both crops ahead […]