
Commentary by AG Capital Management Partners, LP
Inflation
It helps to go back to 10th-grade calculus class to understand inflation. Inflation is a rate of change (first derivative). For example, the latest headline number of 7% tells us that prices are rising on an annualized basis. What if inflation moves higher from here to 10% over the next few months? Accelerating inflation from 7% to 10% captures the second derivative – the change in the “rate of change” that markets will key off of.
Why is this important? Think about recent price rises in used cars and other goods. If the price increases stick at the high levels they are at today but increase no further for the year, inflation for 2022 would be…. zero! For inflation to remain at 7%, let alone accelerate further, prices must continue to rise at a quicker and quicker pace. That’s not how inflation has ever worked in the past. For a frame of reference, look at the chart below, which tracks how inflation moved in the 1970s.
The all-items consumer price index for all urban consumers (CPI-U), the 12-month change
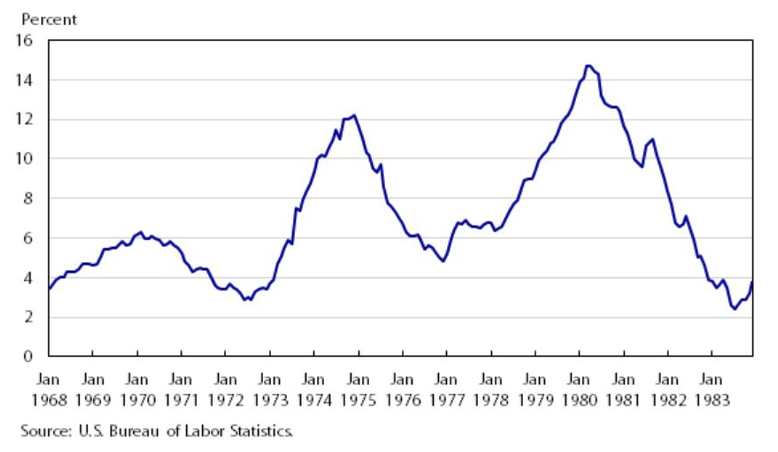
Notice that inflation moved in three distinct waves, starting with the late 1960s Great Society and Vietnam War spending push and continuing through two waves of oil shock and price-wage1 spirals. Why did inflation have those huge peaks and valleys instead of just going up and to the right on the chart above in a straight line? It’s incredibly hard to maintain second derivative growth in any variable, as these are self-limiting processes in a real-world economics context. Price rises force people to cut back – we are seeing that right now as recent reports show that U.S. consumers are tapping credit card lines to make ends meet.
The fiscal thrust from 2020 and 2021, when over $5 trillion in incremental spending was injected to fight the pandemic, is about to turn into the largest fiscal drag since World War 2. President Biden’s plans for additional stimulus appear to be, in the wording of Senator Joe Manchin, “dead.” Underlying trends in the economy are the same as those in 2010-2020: low productivity, poor demographics, and a lack of real economic growth net of fiscal and monetary stimulus. All we have left from the last two years is an overhang of even more unproductive debt.
Even though we believe that we are in the slow process of migrating from the disinflationary world of the last 30 years into a new, structurally higher inflationary decade, our belief for 2022 is that we are on the downswing side of an inflationary move. We believe headline inflation will fall from 7% to perhaps 3-4%, much as it declined three times throughout the 1970s – early 1980s. This sets the stage for our thesis on bonds, which we dive into later in this letter.
1. We intentionally call it a price-wage spiral and not a wage-price spiral as economists usually do. We believe that wages did not lead during these 1970s inflationary periods but rather moved with a lag as unions and workers asked for and received pay increases as they saw their cost-of-living rapidly increase.
Fed rate hikes
Financial markets are projecting five 25 basis point rate hikes for 2022 and another couple of hikes in 2023, with a terminal rate of ~1.75%. That’s the easy part because we can look and see what’s priced in from a Bloomberg terminal. What’s far more interesting is the spread of views around this path – never have we seen so much disagreement by industry thought leaders we follow. A camp believes the Fed will have to hike far more – to perhaps 3% or greater to contain inflationary expectations given how far behind the curve they are. Alternatively, some think the Fed will hike 1, 2, or at most three times (up to 75 basis points) in total before markets break and force the Fed to back off. The former camp might be termed the consensus view by a little bit. The latter has many adherents, and we belong to this camp.
Over the past 40 years, the natural interest rate that the economy and markets can bear has declined from 8% down to ~1-1.5% pre-Covid. We know this from the way that the yield curve has consistently inverted (anticipating a slowdown or recession). In 2018 the Fed overdid things and backed off quickly when they reached 2.5% and couldn’t stomach a swift stock market decline in Q4. Today, that number is certainly lower. Our guess is 1% at most. Today’s 2-year / 10-year Treasury yield curve is only at 50 basis points and threatens to invert should the Fed raise rates a few times.
In a highly financialized economy like the U.S., equity market drawdowns impact the real economy. The tail wags the dog, opposite to how our economy worked in the 1950s and 1960s. We do not see how the Fed can raise rates much at all.
Our view on inflation (can’t keep rising near-term) and on the number of Fed rate hikes (we take the under) feeds directly into our bullish bond thesis and our bearish U.S. dollar thesis. More on both follows.
Portfolio
Long bonds: The bond market isn’t stupid. 5-year forward / 5-year inflation breakevens range between 2-2.4%. That’s what the market expects for long-term inflation, and it’s lower than where it was back in 2012. Although the Fed has bought 20% of U.S. Treasuries in the QE era, the Fed is not setting the price in this market. There are plenty of pension funds, fixed income investors, and foreign reserve managers who make decisions about what to hold and when to enter the bond market each day. Instead of arguing that the long end of the yield curve needs to move to 5% to make sense, it’s incumbent upon the person making that argument to explain why it hasn’t already done so and why expected growth and inflation rates are so low and well contained ten years out.
As the economy slows and as the effects of fiscal and monetary stimulus wear off over the course of 2022, we expect the 10-year Treasury yield to move back toward 1% and are positioned accordingly.
Long gold: Markets confound most participants because people like simple, first-level explanations. They note that gold has failed to move higher as headline CPI hits 7% and state that it is useless. The reality is that gold at its core is the reserve asset of our monetary system and is ultimately a hedge against the government itself – it represents confidence in our system. Over long periods, of course, it hedges inflation. But in the short-term, during a speculative mania (2020-2021) where the junkiest stocks are skyrocketing, and cryptocurrencies like bitcoin are exploding higher, gold will not participate. Over this decade, as the Fed is forced to maintain easy policies to prevent a systemic collapse of asset prices, gold will rise. Gold’s refusal to sell off in recent weeks despite a rise in real yields gives us added conviction in the timing of this trade, as markets sniff out binding constraints faced by the central bank.
Long agriculture: Droughts in both the U.S. last year and in Argentina this year are adding upward pressure to global grain prices. Input costs for fertilizer and nitrogen have quadrupled from two years ago. Current economics for many farmers will not work, and we believe that they will drop corn acres for other crops. China is food insecure when they are actively deleveraging their economy – they will continue to bid aggressively for soybeans and corn to maintain social order.
The coffee market continues to be undersupplied from the effects of a drought in Brazil in late 2020 and a triple frost that devasted the crop in 2021. Live cattle prices should also work their way higher as last year’s herd culling (due to drought) meets continued strong demand.
Short U.S. dollar: Currencies trend off of real rate differentials, not nominal rates, and it’s our view that real rates will begin to trend consistently against the dollar. As such, we think the dollar is on the cusp of another multi-year, structural bear market. We will dive into this topic in a future letter. Still, we’ll end with this provocative statement: the Fed maintains the world’s reserve currency, and we think that the Fed is more likely to abuse its privileged role as guardian of that reserve currency in this decade (2020-2030) than at any other time in the last 50 years.
We will use different currency pairs at different times to express our bearish dollar view, but for now, we are long the British pound (GBP). The pound remains cheap after its sharp sell-off during Brexit in 2016. Notably, it is no longer moving wildly based on headline political news – note the pound’s tepid response to PM Boris Johnson’s “Party gate” scandal. If such an affair had broken out in 2018, we believe that the pound would have sold off much more, pricing in the uncertainty of how Brexit negotiations would play out. Dividend producing U.K. equities are cheap, the pound is cheap, and the U.K. economy seems to have discounted every sort of bad news possible. GBP looks very attractive to us right now.
Equities: We covered our Russell 2000 short position in late January as the market fell a bit too far too fast for our liking. Our thesis on equities is that we are in a slow-motion bear market, like 1969. Bear markets have violent, drawn-out rallies, and we’ll look to re-short equities soon.
On another note, we have spent the better part of a year researching baskets of equities that might complement our commodity themes. For example, we may want to augment our agriculture theme with a fertilizer stock, an area where there are no liquid futures available. Likewise, in the energy space, an investment in a uranium-producing equity would allow us to invest in a bull market that we have high conviction in, and where we have done quite a bit of research on the role of nuclear power as a core green energy transition fuel source, but where there is no option to use futures. We anticipate that these equity baskets might comprise 10-20% of our fund longer-term. Separate account clients will see no impact from this change—more information to come.
Trading futures involves substantial risk of loss and is not suitable for all investors. Past performance is not necessarily indicative of future results.