

“A portfolio where everything goes up together is a bad portfolio,” a wise man once told me. Increasingly, this point seems lost on investors who seem to buy every stock market dip with positive results. Much like the Thanksgiving turkey that feels more comfortable with each passing day, the chance of severe loss might get closer. After all, markets go up AND down. The key to any great portfolio is that separate parts do well in different environments.
Understanding Diversification
Confusion reigns in understanding the vernacular around diversification as the assumption that the negatively correlated part of the portfolio always LOSES when the other side GAINS. This is not always the case. A negative correlation simply means that they do not move together. In practice, one might gain a lot when the other makes little or experience losses together but at differing magnitudes. This concept underpins the rationale behind the traditional 60/40 stock/bond portfolio. The benefit is that investors will often flock to bonds during times of market stress, which will provide above-average returns. However, they would not be a great investment if they only made money when stocks were down.
The Power of Negative Correlation
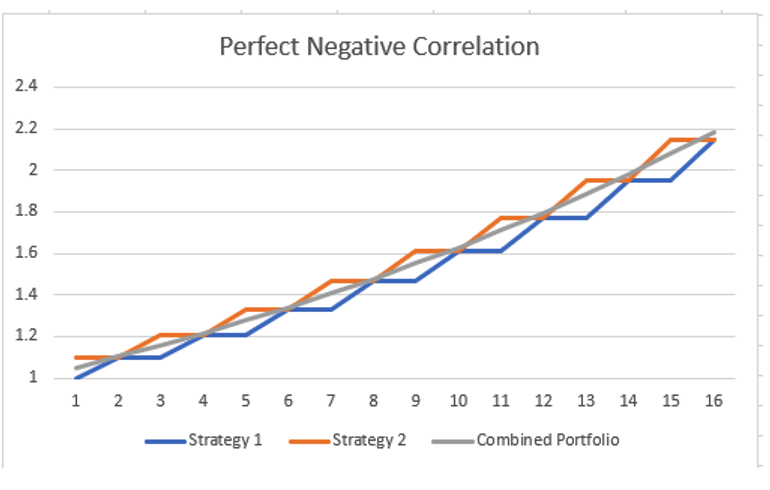
In the example below, I created two hypothetical traders. Each makes 10% a year but only does so every other year. They never achieve the return in the same year, though. The combined 50/50 portfolio makes 5% annually with no volatility (0% standard deviation) but ends up better in the end due to the compounding effect. This occurs despite each trader displaying a standard deviation of 5% by themselves. It is a free lunch with higher returns and less risk. The traders exhibit perfect negative correlation. If, instead of 0% a year, they made 1% or even 5%, the correlation would still be perfectly negative.
Identifying Diversification Opportunities
With this new understanding, we can see why negative or even non-correlation can benefit a portfolio. We, therefore, need to identify where to find this diversification. Traditional portfolios use the simple construction of just stocks and bonds. This worked well using 3-month T-Bills and 10-year Treasury bonds for most of history. Lately, this relationship is breaking down. While the 3-month T-Bill still shows a -0.02 correlation since 2013, the T-bond shows a 0.42 positive relationship over this period. Baa corporate bonds continue to align with equities, but the historical movement went from 0.42 in the 1920s to an even stronger 0.68 in 2013. Using the chart below, we can see that in the past decade, almost everything moved in line with the S&P. Cash, currencies, and managed futures were the only ones with less than a 0.25 correlation.
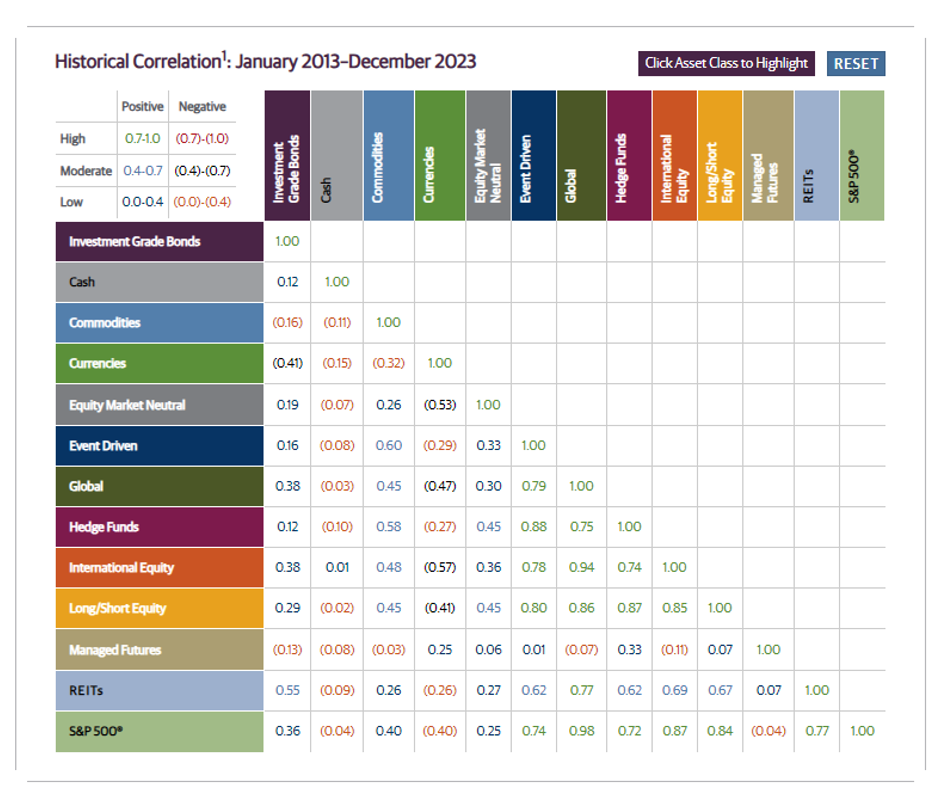
While performance is good over this period, a few things stand out. The movement of funds in the event-driven, global, hedge fund, international equity, and long/short equity categories ran in concert with the S&P. On one hand, this should be surprising, especially in the hedge fund category, which is running at a 0.72 correlation. It does, however, match the move away from baskets of stocks to indices. This results in bad days for one stock to be poor for all of them as massive flows move in and out of ETFs, driving hundreds of company values at once. This is especially true for outsized stocks like Microsoft and Apple, which comprise over 13% of the index. A bad day for them is not good for anyone.
The Role of Managed Futures
Managed futures, by contrast, offer the most bang for the buck with a consistently low correlation to almost everything. This occurs for a few reasons. The obvious one is that they trade long and short. This is especially easy to do with futures contracts, which pair every long with a short. The second is that they trade across hundreds of markets in multiple sectors. This is a blessing and a curse as most investors pay attention to stock indices and may not consider energy, currencies, or fixed income a relevant opportunity indicator. Finally, the majority of CTAs benefit from volatility. This last one is what investors love and hate about managed futures. When things are calm, most asset classes do well because they hold positions for long periods, closely tied to the equity market and growing GDP. In contrast, futures traders look for explosive directional moves that break above-defined ranges or through patterns. They often underperform in quiet times and outperform in stressful times. This does not mean they cannot perform in quiet equity markets. After all, they look across a large swath of options. They also can make up ground very quickly when something does occur.
Navigating Market Predictions
CNBC and other financial news networks exist to drive ratings, not inform investors. The easiest way to drive this engagement is to make bold predictions. Truthfully, the best anyone can do is make educated guesses. While these prognostications might be well-informed, some of history’s most significant market moves surprised almost everyone. We found out who made the best calls AFTER the fact. Setting up your portfolio right from the outset with investments that can thrive in different environments might be the safest path. It might not be fun to watch all the time, but doing the right thing is never easy.
Photo by Christian Perner on Unsplash
Related Posts

Race to Nowhere: Markets Pause Before the Next Big Move
Running on a treadmill is one of my least favorite activities: you expend a lot of energy but end up exactly where you started, only out of breath. So far in 2026, financial markets are behaving similarly. There’s intense activity, but the major indices have gone almost nowhere. As of mid-February, the S&P 500 is […]

Systematic vs. Discretionary Trading: Which Strategy Is Right for Your Portfolio?
Investors face many choices when selecting investments. Historically, the main divide was between fundamental and technical trading. The growth of computer systems for trading has introduced a potentially larger variable that will only increase as AI advances, whether in systematic (rules-based) or discretionary (human judgment) trading. In just my 20 years working in the industry, […]

The Evolution of Trading from Systematic to AI
Is AI the next step in the evolution of trading? History proves new tools storm the markets, then high adoption erases their edge. What can futures trading history teach us about AI’s trajectory? The 1980s: Rise of Rules-Based Trading Building on simple regression models that aimed to identify patterns across sectors, the 1980s showed that […]