

The US Presidential election will generate endless talk about who is or is not “paying their fair share” and what tax policy should look like at the national level. Less discussed is the continuation of “tax cut fever” at the state level. Flush with cash from pandemic payouts from the government, many states decided to lower rates to encourage economic activity. Combined with the ability to work from home, this affects the movement of people and capital across the United States. Should this trend continue, states with lower taxes may gain electoral clout. Unlike many debates about social policies, how the country pays its bills is one I believe is worth having. It is important first to establish how we cover our debts now.
Federal and State Taxation
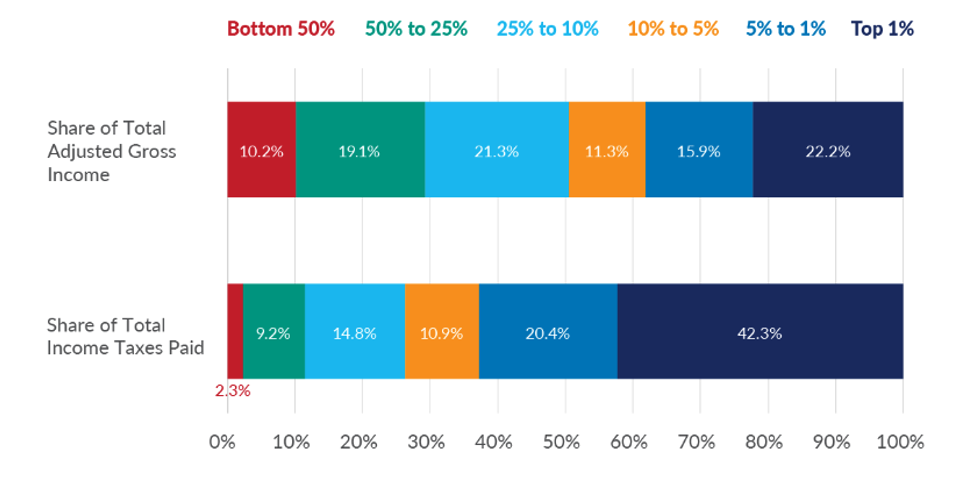
Taxes in the United States are paid through federal tax collections driven at the national, state, and local levels, controlled by elected officials in those locales. While Federal is uniform, states get money from various taxes on income, sales, corporate revenue, tourism, and real estate. Taxation is very progressive at the national level, where the top earners pay a higher percentage than the lowest. In fact, the top 1% pay over 42% of all taxes. This does not include transfer payments for retirement, food benefits, medical coverage, or housing paid out. Logically, the bottom quintile receives the most money for these services, making their contribution a net negative.
Half of Taxpayers Paid 97.7% of Federal Income Taxes
Shares of Adjusted Gross Income and Federal Income Taxes Paid by Income Group, 2020
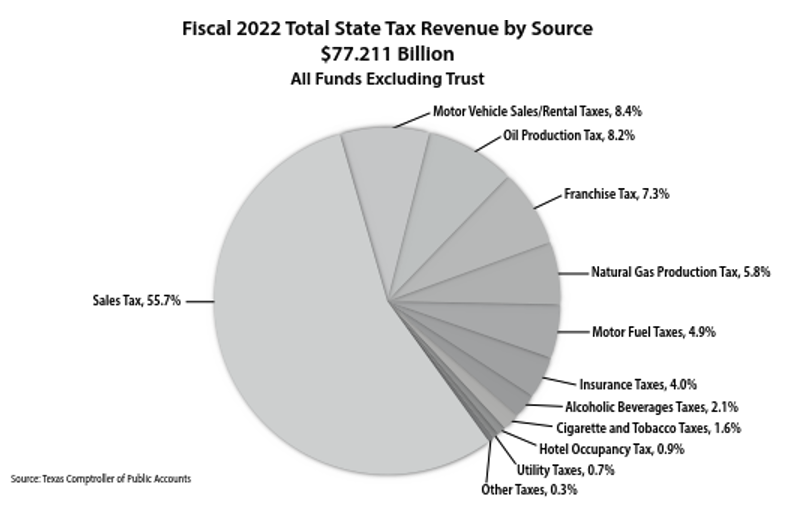
State tax burdens can either be progressive or a flat percentage of income. In states like Illinois, the constant income percentage is offset by high real estate taxes that pay for local services, including schools and emergency services. Texas is one of many states without an income tax. They make this up through a myriad of taxes (shown below) but primarily through sales taxes, vehicle registrations, and oil production fees. States like Florida also avoid an income tax but generate significant revenue from tourism and fees related to hotels and theme parks.
Migration and Tax Burdens
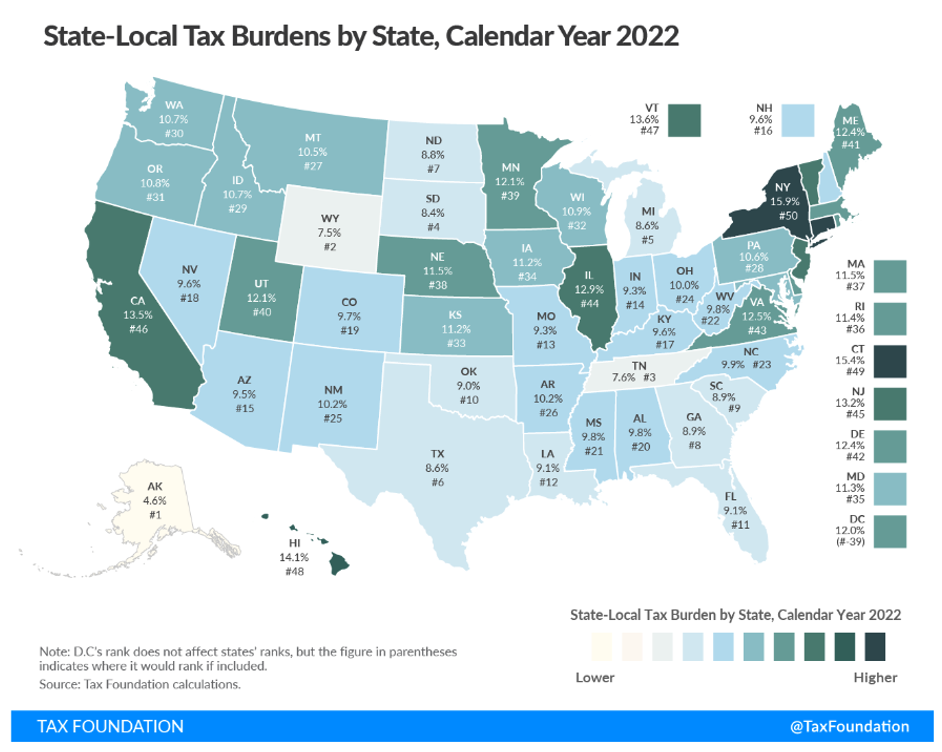
Looking at the tax burdens across states, we see a wide dispersion of levels. It might not surprise anyone that in 2022, the largest outmigration occurred in New York, California, and Illinois. All three states maintain large populations and high tax rates. Idaho, Florida, and South Carolina saw the best net migration numbers. These inflows pushed them to the top spots for economy and growth, as judged by US News. The implications for this shift are far-reaching as the spending levels in the “high tax” states reflect service levels commensurate with those taxes. If the beneficiaries of this spending reside at the low end of the economic spectrum, it is unlikely they will leave.
Economic and Revenue Trends
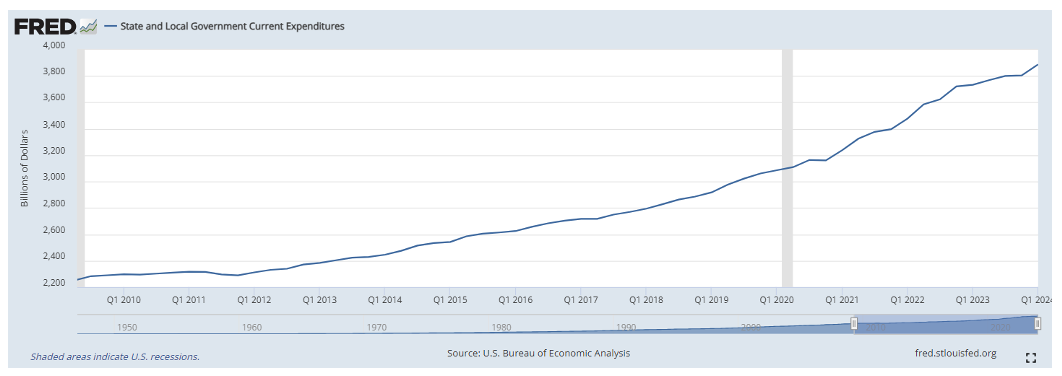
Reading the news might give the impression that states are starved of revenue. According to government figures, state tax collections doubled in the past 13 years for an average gain of 7.5% a year (not compounded). You will notice that spending grew similarly, going up almost 70% over the same period.
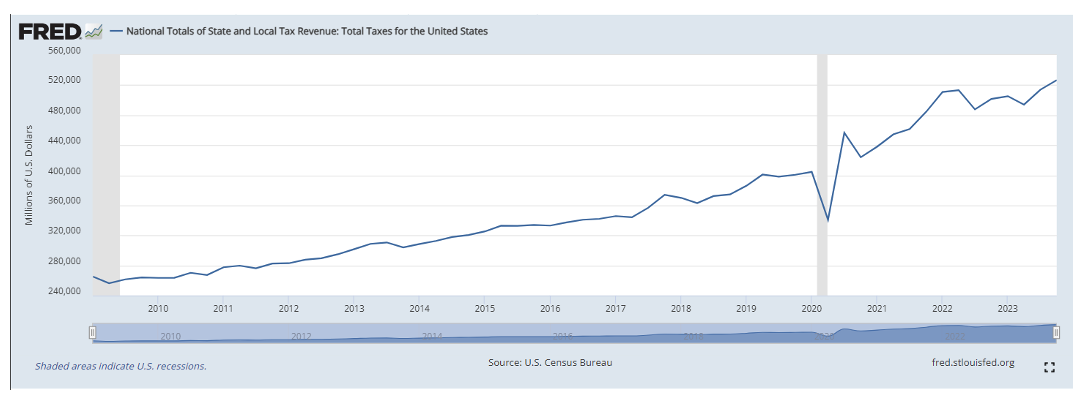
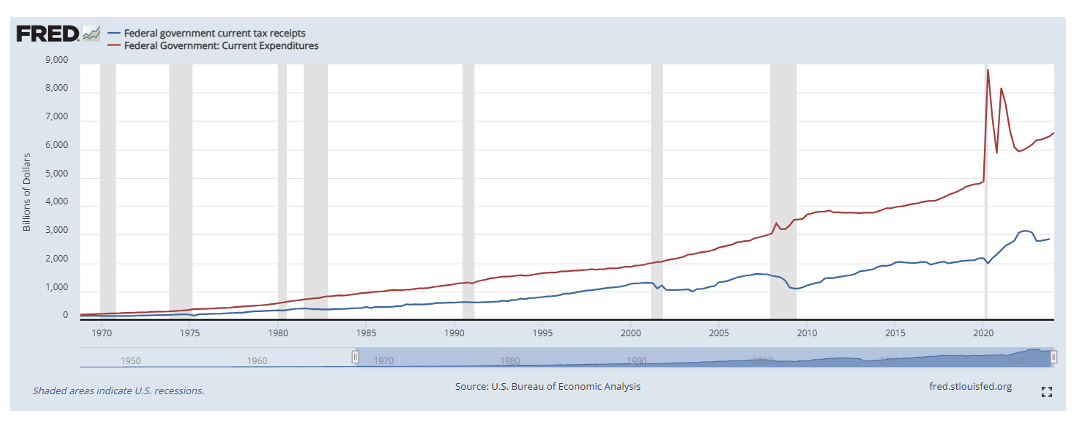
Federal revenue collections followed a similar path as tax inflows maintain a fairly stable trajectory that runs significantly below the growth rate of spending. In my opinion, the curious part of this chart is that tax policy seems to provide little insight into revenue generation. In fact, high tax periods seem to generate similar results to lower tax eras. The only periods where the trend is interrupted appear to be during recessions. Famed Reagan economist Arthur Laffer theorized that the so-called Laffer Curve described an incentive-based system where high taxes discouraged growth and lower taxes spurred the economy. Thus, maximum government revenue is achieved at an inherent equilibrium point.
Political and Economic Implications
Many states seem to display this effect as jobs and capital move to them. Revenue in Florida climbed over 32% from the second quarter of 2019 to the same period in 2022. Weights of representation in the US Congress and the Electoral College, which chooses the President, may adjust significantly if this migration continues. Those who moved to lower-tax states might also vote for candidates who advocate for lower taxes. Rising debt must be addressed at some point, but as shown here, the answer to how to solve that dilemma is varied.
Jacob Bernstein, the Chair of the United States Council of Economic Advisers, advises President Biden was asked about this funding question related to money printing and the national debt. His answer was not reassuring.
Expect more grand proclamations from both sides during campaign season about how to pay for our growing spending appetite. The truth is that an expanding economy lifts all boats, and if state migration patterns tell a story, it is that capital is mobile and will gravitate to where it will rise the most quickly. The rich pay most of the taxes already. Unless our tax code changes dramatically, the incoming revenue stream will change little. Any serious conversation should start with these facts. I am not holding my breath.
References
Photo by Christopher Burns on Unsplash
Related Posts

Race to Nowhere: Markets Pause Before the Next Big Move
Running on a treadmill is one of my least favorite activities: you expend a lot of energy but end up exactly where you started, only out of breath. So far in 2026, financial markets are behaving similarly. There’s intense activity, but the major indices have gone almost nowhere. As of mid-February, the S&P 500 is […]

Systematic vs. Discretionary Trading: Which Strategy Is Right for Your Portfolio?
Investors face many choices when selecting investments. Historically, the main divide was between fundamental and technical trading. The growth of computer systems for trading has introduced a potentially larger variable that will only increase as AI advances, whether in systematic (rules-based) or discretionary (human judgment) trading. In just my 20 years working in the industry, […]

The Evolution of Trading from Systematic to AI
Is AI the next step in the evolution of trading? History proves new tools storm the markets, then high adoption erases their edge. What can futures trading history teach us about AI’s trajectory? The 1980s: Rise of Rules-Based Trading Building on simple regression models that aimed to identify patterns across sectors, the 1980s showed that […]