Many traders and investment managers have the desire to measure and compare CTA managers and / or trading systems. Red Rock Capital believe risk-adjusted returns are one of the most important measures to consider since, given the inherent / free leverage of the futures markets, more return can always be earned by taking more risk. The most popular measure of risk-adjusted performance is the Sharpe ratio. While the Sharpe ratio is definitely the most widely used, it is not without its issues and limitations. Red Rock Capital believe the Sortino ratio improves on the Sharpe ratio in a few areas. The purpose of this article, however, is not necessarily to extol the virtues of the Sortino ratio, but rather to review its definition and present how to properly calculate it since we have often seen its calculation done incorrectly.
Sharpe Ratio
The Sharpe ratio is a metric which aims to measure the desirability of a risky investment strategy or instrument by dividing the average period return in excess of the risk-free rate by the standard deviation of the return generating process. Devised in 1966 as a measure of performance for mutual funds, it undoubtedly has some value as a measure of strategy “quality”, but it also has a few limitations (see Sharpe 1994 for a recent restatement and review of its principles).
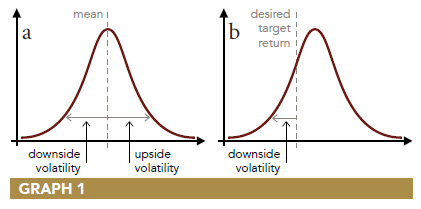
The Sharpe ratio does not distinguish between upside and downside volatility (graph 1a).
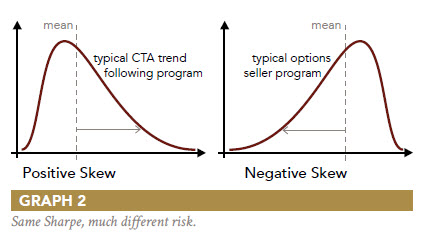
In fact, high outlier returns have the effect of increasing the value of the denominator (standard deviation) more than the value of the numerator, thereby lowering the value of the ratio. For a positively skewed return distribution such as that of a typical trend following CTA strategy, the Sharpe ratio can be increased by removing the largest positive returns. This is nonsensical since investors generally welcome large positive returns. To the extent that the distribution of returns is non-normal, the Sharpe ratio falls short. It is a particularly poor performance metric when comparing positively skewed strategies like trend following to negatively skewed strategies like option selling (graph 2). In fact, for positively skewed return distributions, performance is actually achieved with less risk than the Sharpe ratio suggests. Conversely, standard deviation understates risk for negatively skewed return distributions, i.e. the strategy is actually more risky than the Sharpe ratio suggests.
Sortino Ratio
In many ways, the Sortino ratio is a better choice, especially when measuring and comparing the performance of managers whose programs exhibit skew in their return distributions. The Sortino ratio is a modification of the Sharpe ratio but uses downside deviation rather than standard deviation as the measure of risk—i.e. only those returns falling below a user-specified target (See “desired target return,” graph 1b), or required rate of return are considered risky.
It is interesting to note that even Nobel laureate Harry Markowitz, when he developed Modern Portfolio Theory in 1959, recognized that since only downside deviation is relevant to investors, using downside deviation to measure risk would be more appropriate than using standard deviation. However, he used variance (the square of standard deviation) in his MPT work since optimizations using downside deviation were computationally impractical at the time.
In the early 1980s, Dr. Frank Sortino had undertaken research to come up with an improved measure for risk-adjusted returns. According to Sortino, it was Brian Rom’s idea at Investment Technologies to call the new measure the Sortino ratio. The first reference to the ratio was in Financial Executive Magazine (August, 1980) and the first calculation was published in a series of articles in the Journal of Risk Management (September, 1981).
Dissecting the Ratio
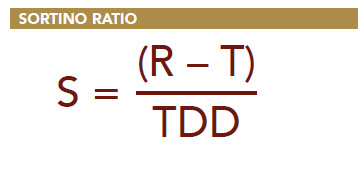
As the definition depicts above, where:
R = the average period return
T = the target or required rate of return for the investment strategy under consideration
In Sortino’s early work, T was originally known as the minimum acceptable return, or MAR. In his more recent work, MAR is now referred to as the Desired Target Return. TDD = the target downside deviation. The target downside deviation is defined as the root-mean-square, or RMS, of the deviations of the realized return’s underperformance from the target return where all returns above the target return are treated as underperformance of 0.
Mathematically:
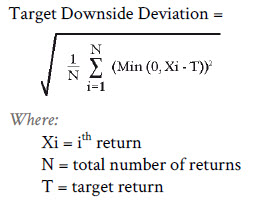
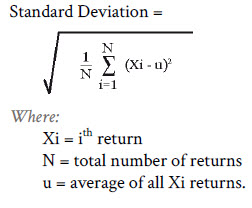
The equation for TDD is very similar to the definition of standard deviation:
This defines both the Sharpe and Sortino Ratios and how they are applied. We will take a closer look later this week at the differences between these two ratios.