 Until the end of last month and as outlined in June’s letter, calm and confidence was not only reflected in the equity markets but in numerous gauges related to U.S financial conditions and the shadow banking system. In this context a recent report from the Federal Reserve Bank of Atlanta attempts to measure the shadow Federal Funds Rate (“SFFR’) based on a model that was developed from Wu and Xia. Since December 2008 the Federal Funds Rate has been in the 0 to ¼ percent range targeted by the Federal Open Market Committee. This 50 page research report is used to summarize the macroeconomic effect of unconventional monetary policy at the zero lower bound. In the bank’s own words; “The result gives us a tool for measuring the effect on monetary policy at zero lower bounds”. Based on their analysis the SFFR level had roughly flat lined for two years ending July 2013 in the range of -1.25 to -1.5%, but in the past year declined sharply and in the past two months has hovered in the vicinity of -3.00%. The extremely low levels on the SFFR had a beneficial impact on several other Federal Reserve reports that reflect US financial health. Composites of these measures from government reports were detailed month as they were at the most favorable levels in 20 years. The liquidity spigot is not just domestically evident, the shadow banking system in Europe has surged as well. The issuance of European risk assets ballooned in the second quarter and outpaced growth rates in the US debt markets. For instance, European junk bonds sales doubled to $78 billion (US was $69 billion), a record, while collateralized loans hit a record $38 billion. Global issuance of bonds in the 2nd quarter totaled $1 trillion, also a record, an amount that roughly equaled the announced global mergers, (second highest on record). Regarding European equity markets, earning forecasts for Europe for 2014 and 2015 have continued to shrink and the roughly 100 basis point decline in German Bond Yields this year finds the DAX in minus territory.
The HFRX Equity Hedge Fund this year has underperformed the S&P by a noticeable margin. Most common drivers for performance are twofold: One, net exposure towards equities, two, stock selection. According to the data provided by one of the largest Broker- Dealer’s, net Hedge Fund exposure stands at nearly 100%, a robust level and thus market exposure is not the issue. For the record, based on this survey these levels have varied from as low as 55% entering 2012 to as high as +125% in April 2011. A broad based measure that gauges stock selection uses Investor’s Business Daily’s Mutual Fund Index (“MFI”) which comprises 20 leading growth funds. Many of the mutual funds selected in this composite hold concentrated stock positions. According to the IBD web site, “outperformance in this Index implies active management or stock pickers have the upper hand”. As a reference points, in 2011 where a 19.5% selloff occurred in the summer and the S&P finished little changed on the year the MFI lost 4.5%. In 2004 the MFI gained 12.5% while the S&P rose 9%. This year the MFI has lost 1.1%, suggesting a more difficult environment for stock selection. In the first three days of the month stock prices advanced by over 1.5% and had it not been for the last trading day the monthly range would have been one of the narrowest in years. In the middle of the month the S&P declined by over 1%, the first such 1% move in either direction in over 60 trading sessions, a rarity. As mentioned two months ago “a few intermediate indicators registered buy signals which led to a 5% advance in stock prices” and at this juncture is no longer as significant.
Related Posts
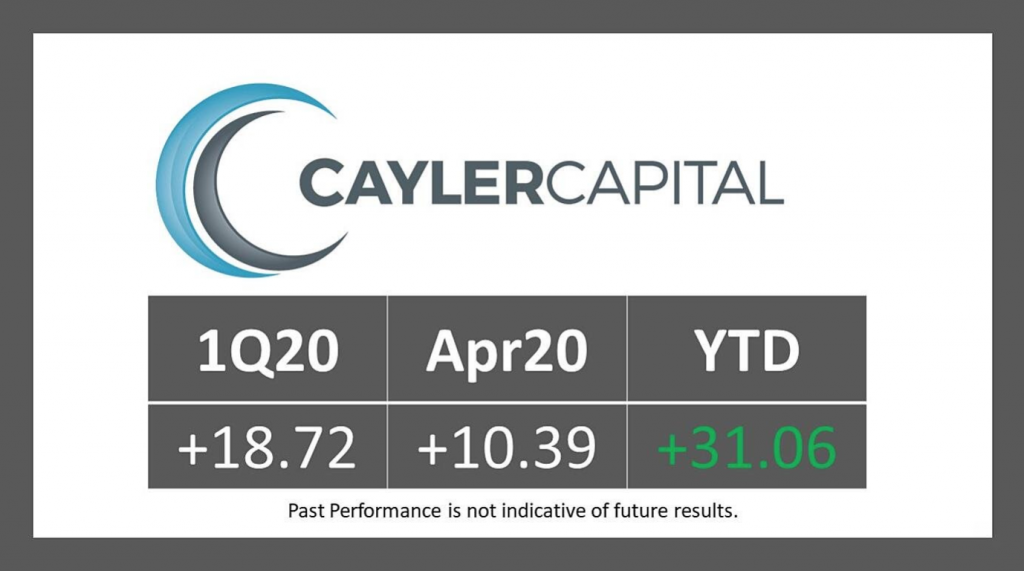
Cayler Capital | April Performance Commentary
After finishing off one of the wildest quarters of my trading career, April managed to take the cake. For those that missed it (not sure how you possibly could have), oil settled negative $37. The effects of this were immediate: risk barometers had to be recalculated, option models switched, and most importantly was the immediate […]

AG Capital: Fade to Famous
There’s something about being quoted in the Wall Street Journal or making it onto Bloomberg TV that often leads to terribly inaccurate judgement calls (at least in the short-term). A classic example of this is Ray Dalio’s famous interview from Davos in early 2018, where he declared that “If you’re holding cash, you’re going to feel pretty stupid” just before the market cratered -12% and potentially may have begun a topping process for the entire bull market run from 2009.

Adalpha Asset Management – Seeking Volatility
“What just happened?” is becoming an all too common phrase for market watchers over the past few weeks. Whether it be the Fed Chairman giving a talk, interest rate behavior, or a short tweet from the President, markets have been responding aggressively. Over long periods of time all of these things could often be put on the category of “noise” but in the meantime anyone watching their portfolio can get an ulcer.