Written by: Bryen Deutsch
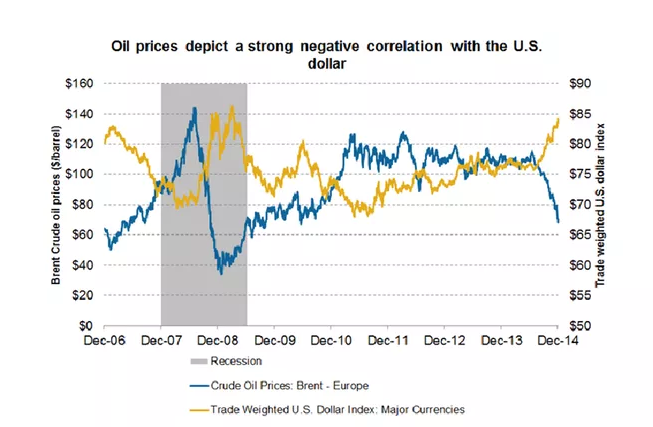
The 200-day moving average is a widely held long-term trend indicator. Markets trading above the 200-day moving average have a tendency to be in longer term uptrends. Markets trading below the 200-day moving average tend to be in longer term downtrends. Last July, the US Dollar Index crossed above the 200 day moving average and rallied over 25% until it topped out in March. Last July, Brent and WTI crossed below the 200 day moving average and proceeded to crash with each losing over 50%.
Coincidence, I think not.
Furthermore, the dollar topped in the late March/early April time frame and had a healthy correction. At the same time, crude oil bottomed and underwent a major rally thru mid-May before now pulling off over $5 from the highs. Yet during the entire corrections in the dollar bull trend and the crude bear trend, both markets did not cross back above their respective 200 day moving average. Wait a minute.
The dollar correction from the bull trend ended on May 15 and now appears to be making a move to test the highs from March. The crude oil peaked on the exact same day May 15 and is now trending back down. Could it be that easy?
Since last July, crude oil traders have weathered between ISIS, Saudi Arabia, Libya, Russia, etc. (You get the point) multiple geopolitical situations. As well, we have seen major production changes in the US, record supplies, and most recently near capacity storage. And do not forget, OPEC and the Saudi play of taking shale oil out of business. One week Goldman Sachs and notable analysts are saying oil is going below $30 and oil is going to average $50 for 2015. Before you know it, these predictions are being changed and the low is in and we are moving higher. These experts have to be more in the know than anybody else right because they get all this news before anybody else. Maybe not.
I can tell you that major trend following CTAs re still bearish commodities and bullish king US Dollar. Just overlay a long term Dollar and Crude Oil chart. History will tell you that these markets are inversely correlated. So whether developing your own trading plan in the energy markets or analyzing the performance of a trend following CTA, you, you might want to do yourself a favor and look at a chart of the US Dollar and stop being fooled by the trash talking of the bulls and the bears as they defend their positon.
Shoot me an email or give me a call if you want weekly support or resistance for any of these markets. If you have questions regarding the energy markets, would like daily support and resistance emailed to you, or would like to discuss an investment in the futures markets, feel free to call me directly at 570-657-0523 or send an email to bdeutsch@iasg.com. You can also reach us through our website at www.iasg.com and view our database featuring over 500 CTAs.