Trend following is the most prevalent strategy utilized throughout the managed futures industry. What is the best way to objectively analyze, measure, and compare the performance of a particular group of trend following CTAs?![]()
Last fall we attempted to answer this question by publishing a research paper that introduced our own metric that measures and compares the “goodness” of similar managers’ returns. This article updates that original piece, and the measurements and ranking methodology that we initially introduced remain the same.
Due to the inherent (i.e. free) leverage found in the futures markets, risk-adjusted returns (not absolute returns) are the only proper way to compare similar manager returns. A CTA investor subjectively chooses at what level margin-to-equity to operate a program – but the level chosen is not, in and of itself, a source of “goodness.”
This point is repeatedly misunderstood by many in the managed futures industry. A program run with a higher margin- to-equity ratio will produce a higher compound rate of growth at the price of higher drawdowns (periods of loss). For example, assume one manager produces a 20% net return over 12 months and another manager only produces a 10% net return. If the second manager used only half as much margin-to-equity, and produced only half as much volatility in his returns, then the two managers’ performance were essentially equal on a risk-adjusted basis. However, the first manager will often win awards and be touted for having “better” performance – which demonstrates a lack of understanding of, or at least a lack of concern for, a crucial aspect about managed futures and how to correctly measure performance (Past Performance not indicative of future results).
Our proprietary metric aims to step into the shoes of a loyal, long-term investor with any of the managers that we analyze, and asks, “What aspects of my CTA manager’s performance are most important to me?” The following table conveys the most important aspects, the proxies we use to measure them, and the weight we give to each measurement in our weighted final ranking:
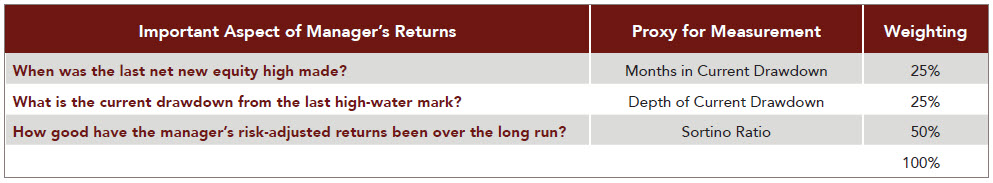
For the period since the inception of our Systematic Global Macro (trend following) program, September 2003 to August 2014, we measure each aspect of the managers’ returns with our proxies and then assign them a weight similar to how one calculates a grade point average.
Once we have the rankings for each of the managers on the individual aspects, we can combine the rankings (at their respective weights) to arrive at a final rank. This is a simple, quick method to rank similar futures managers against one another. By design, to simplify the process, the rankings do not have proportional information embedded in them, i.e. how much better is Manager A than Manager B, etc. In considering the results of our ranking, the following should be noted:
A CTA’s returns, volatility, and drawdowns are functions of a subjective decision that has been made by the manager – i.e. at what volatility will they run their program. [Said another way: at what margin-to-equity ratio will they run their program.] For this reason, only analyzing the managers’ months in current drawdown and the depth of that current drawdown is not sufficient. A risk-adjusted metric (“Reward to Risk Ratio” in the table) must be applied that normalizes managers’ returns against one another.
As we convey in our white paper, Sortino: A ‘Sharper’ Ratio, the Sortino ratio is a more appropriate measure to use for this purpose than the Sharpe ratio because the Sharpe ratio assumes that the returns it is measuring are normally distributed, and, hence, unfairly and incorrectly penalizes managers whose returns exhibit positive asymmetry (skewness). In reality, investors typically welcome upside volatility and perceive only downside volatility as actual risk.
In addition to the 22 managers we analyzed, this year we added two well-known and respected industry bench- marks: The Newedge CTA Index and the Newedge Trend CTA Index. The former represents the equal-weighted performance of the top 20 largest diversified CTAs open for investment. The latter represents the equal-weight- ed performance of the top 10 largest trend following CTAs open for investment.
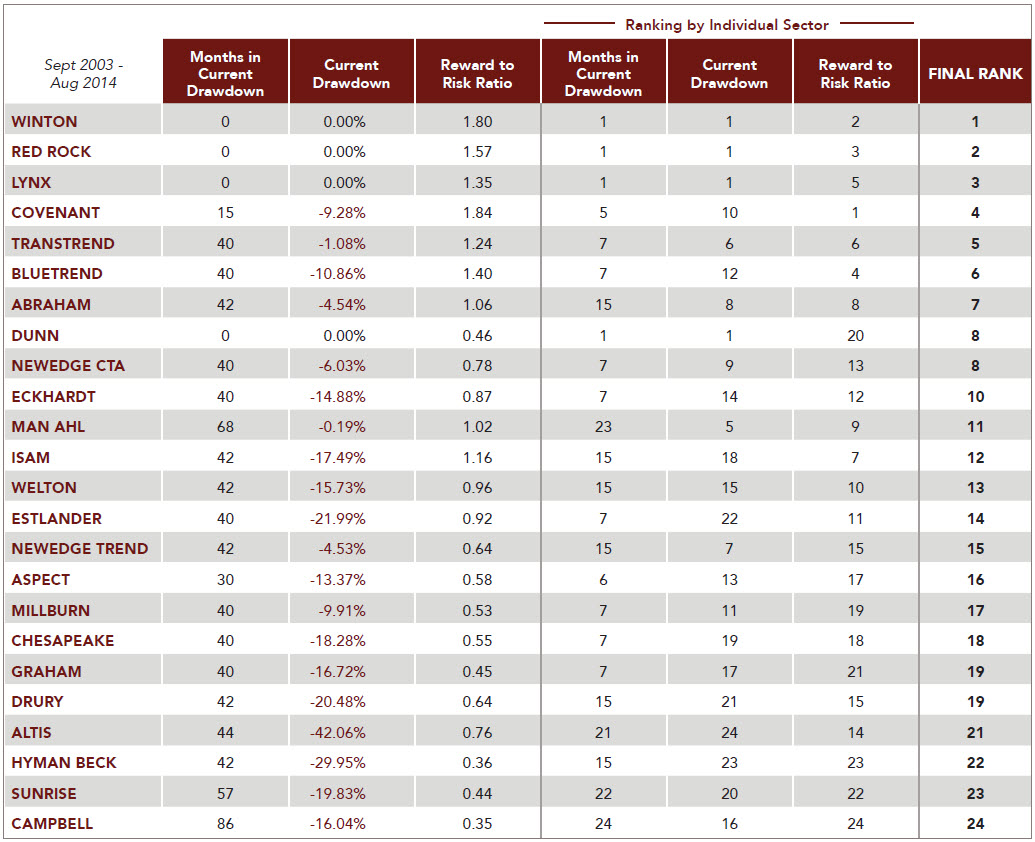
Past performance not necessarily indicative of future performance. For informational purposes only. Red Rock Capital, LLC not responsible for modifications to or accuracy of performance data.Sources: BarclayHedge, Altegris, IASG, Bloomberg. Reward to Risk Ratio is Sortino Ratio (Target = 0) for period September 2003 – August 2014 except: BlueTrend is from April ‘04; Welton is from June ‘04.
Observations & comments about the results:
Winton continues to lead the pack and deserves the kudos that it receives.
Four CTAs on the list just made net new equity highs and, hence, are not in a drawdown. This gives them a #1 rank in both categories which has boosted their overall rank – as it should.
While Winton has approximately $25 billion assets under management, managers with final rankings of #2 – 24 have a combined approximately $20 billion of assets under management, however, a significant portion of it does not seem to be invested with managers ranked highly on the list. The results of this paper suggest investors may have been / be better served by concentrating on some of the more “boutique” managers on the list such as Red Rock Capital, Covenant or Abraham.
An interesting related exercise to our objective ranking methodology is to subjectively study and rank the attractiveness of each of the managers’ VAMIs / growth curves over our study period. We found that Winton and Lynx win out in this category. Interestingly, the “just eye balling it” approach chooses 2 of the quantitatively chosen top 3 finally ranked managers. The exception is Red Rock Capital who ends up with a higher overall rank than the impressive $4.7+ billion CTA Lynx. This is because Red Rock has a higher Sortino Ratio (though Lynx has a slightly higher Sharpe Ratio).
Good “recent performance”, as so many like to focus on and reward with praise, needs to be kept in the correct perspective. For instance a manager could be up 10% one year and then up another 5% the following year (and win awards, etc.) then down -11%, and back up 8%… yet the entire time still be under their high water mark. Does a savvy, loyal investor who has not seen a net new equity peak in 55+ months really care if a manager is “up” this year to date? We argue that they should not.
Considering the length of some of the managers’ drawdowns, we believe concern is warranted, from a current or prospective investor standpoint, as to whether or not such managers will ever make another new equity high again. Unfortunately, as we have seen too many times before in our industry, managers who share the same concern conveniently close down that particular program – only to launch another. Prospective investors would do themselves a favor by being skeptical of firms launching new programs in the wake of ailing flagship programs.
In this article we present an efficient and objective way to objectively measure the performance of similar trend following CTA managers. Since late 2013, several of the managers in our analysis along with the trend-based CTA indexes have picked up some steam – and with the recent directional volatility seen in the global currency and commodity markets – there’s a possibility the environment will continue to shift to a good one for trend followers.
– Thomas N. Rollinger, Managing Partner
– Scott T. Hoffman, Partner