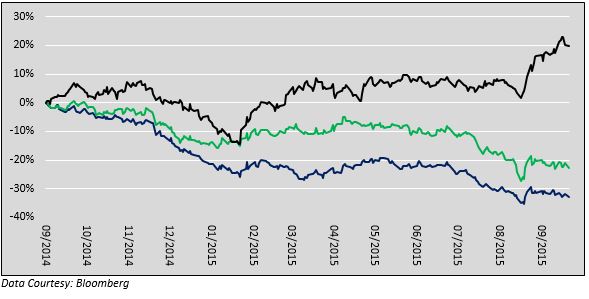
The chart above plots the performance of the Commodity Research Bureau (CRB) index, a benchmark measuring the prices of 19 diverse commodities. The legend is purposefully omitted so that we may pose the following question: If the lines represent one indicator, why are there 3 lines? The answer lies not in the commodity prices underlying the index, but in the currency used to express the prices. The blue line represents the CRB index as it is commonly expressed, in U.S. dollars (USD). The green line is denominated in euros and the black line in Brazilian reals. This graph highlights that the currency in which a commodity is denominated can have a meaningful effect on prices.
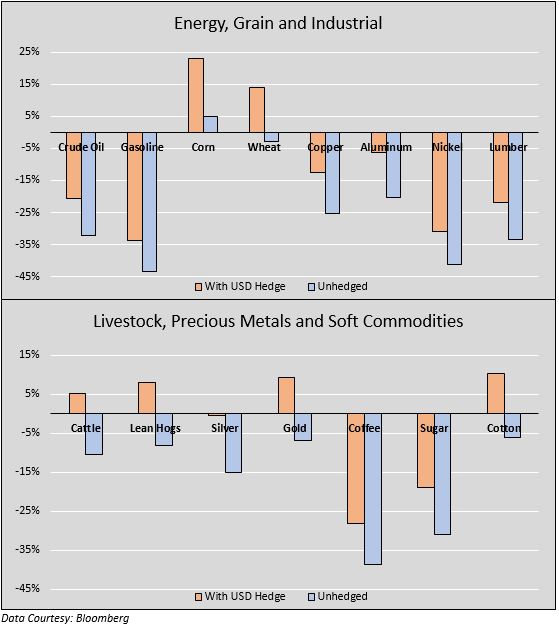
The charts below display the degree to which USD strength negatively affected individual commodity prices over the last year. The bars compare the respective commodity’s performance in USD (light blue) versus the performance assuming no change in the USD (tan).
The USD Effect on Commodity Prices
Commodity Demand versus USD
While the significance of the USD as the denominating currency is a big factor in commodity prices, the value of the USD also plays a fundamental role in shaping demand for most commodities. As stated in Part I and Part II of this series, USD strength is effectively a tightening of global monetary supply. As the USD appreciates, investors divest of non-USD investments and the currencies in which they were based. This process strips foreign nations of needed funding and thereby causes financial conditions to tighten resulting in decreased economic activity and commodity demand.
This is one important way USD strength is adversely affecting China. They are experiencing a weakening of domestic and global demand for their products and a slowing of investments in domestic infrastructure. The effect on commodity prices has been large but comes as no surprise considering China accounts for nearly half of the global use of many major commodities including: (data courtesy Michael Pettis)
- Iron ore 7%
- Coal 9%
- Steel 4%
- Aluminum 40.6%
- Pigs 46.4%
- China used more cement in the last 3 years than the U.S. did in the entire 20th century
As the world’s reserve currency, in which over 60% of all global transactions take place, the USD is a major force driving commodity prices. In times of USD appreciation, investors in commodities are at risk of declining valuations. Accordingly, they should be cognizant of shifting regimes and have dependable USD forecasts. The following factors should be considered in determining the outlook for the USD:
Driving USD strength:
- The U.S. has relatively tighter monetary policy than most other nations
- Carry trade unwind
- Flight to quality as financial markets struggle
- Significantly higher U.S. interest rates than Japan and Europe
- Stronger and more diverse economy than most of the world
Potential to create USD weakness:
- Switch in Fed policy towards QE or negative interest rates
- US Economic weakness
- Economic rebound in China
USD Trends 1980-Current
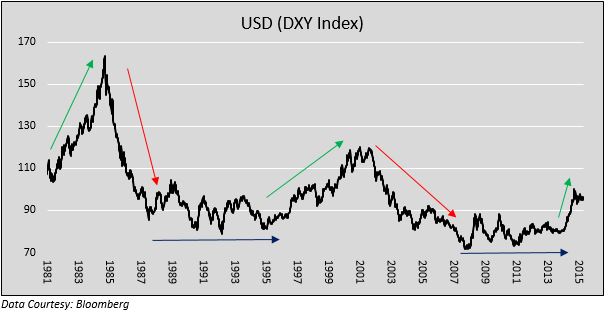
Since 1980, the USD has been in a directional trend for approximately half the time and relatively range bound the other half. The most recent upward trend, which started in June 2014 has taken the USD index 20% higher. If this rally matches the one from 1995-2002, it may only be half-way done. More concerning would be a scenario where the recent move higher in the index replicates the early 1980s. If this were the case, the USD may only be in the first few innings of what could be a 100% increase. In either scenario the price pressures on commodities, as well as the profits and potential solvency of commodity producers, may become more troublesome.