Part 2 of our series on bonds “Bonds – Is Credit Growth Hitting its Limits?” discussed the likelihood that the demand to borrow could stay weak, keeping the demand curve from shifting right and therefore playing an important role in keeping a lid on higher interest rates. In this final article of the series we focus on factors that investors should consider to help gauge demand for bonds.
Real Yields
Three primary factors influence bond investors – yield or expected return, term to maturity and credit risk. For the sake of simplicity, the discussion in this article focuses on 10-year risk-free bonds in an effort to isolate yield dynamics. Like all investors, bond investors, strive to assess how potential investments may increase their wealth. To accomplish this, they subtract the current nominal yield from inflation expectations to compute what is called the expected real yield. To stress the importance of real yields consider buying a bond with a 20% risk free yield. At first glance a 20% return without risk sounds great, but if inflation increases at 30%, 10% of the investment dollars would be lost due the decreased purchasing power resulting from inflation. It is therefore important to consider more than the absolute nominal level of yields, high or low.
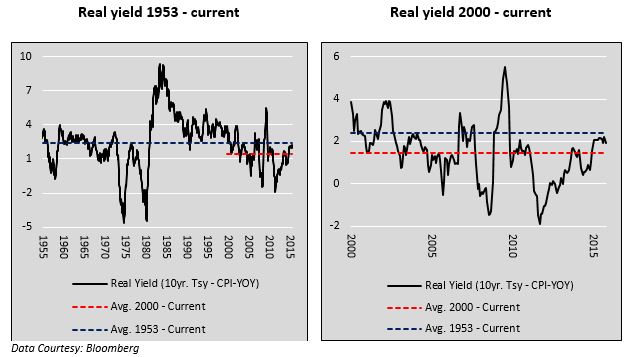
U.S. Treasury 10 year bond real yields, as shown below, are currently above the average for this century (red line) but below the average since 1953 (blue line).
Inflation Trends Economic Growth
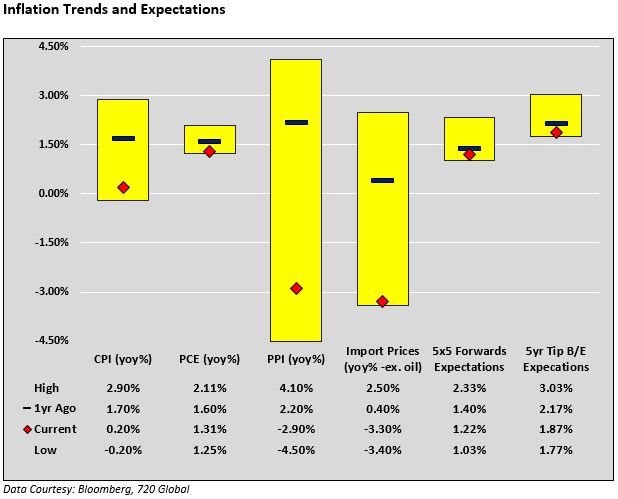
Recent inflation and inflation expectations data as highlighted below are at or near the lowest levels since 2012 and lower than observations from a year ago.
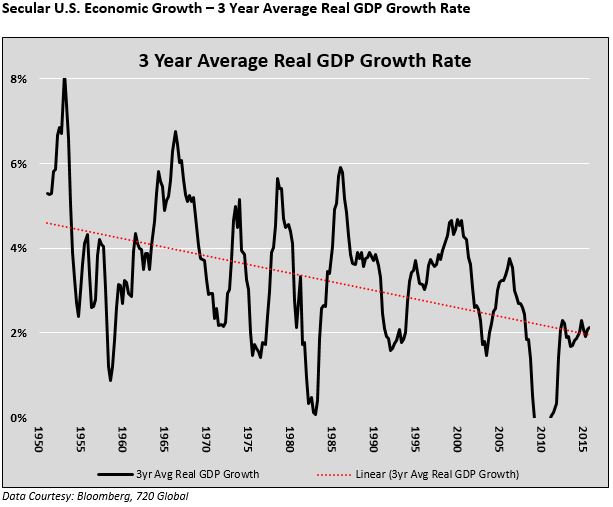
Economic growth tends to be highly correlated with inflation. Despite ebbs and flows in economic growth, GDP growth has trended lower for decades. Secular GDP growth, as graphed below, illustrates that the highest growth rate of the current recovery cycle, is only on par with the troughs witnessed in many prior recessions.
Weak domestic and global economic growth and falling inflation trends/expectations argue that inflation may continue to be low or even lower in the future, thereby capping bond yields.
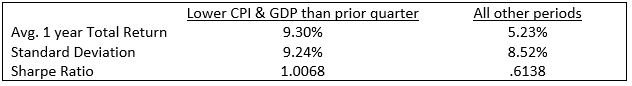
The following table offers historical context on the relationship between growth and inflation and their influence on bonds returns. In years where growth and inflation fell, subsequent one-year returns on 10-year U.S. Treasury bonds were materially better than in years when growth and inflation did not fall. The higher Sharpe Ratio denotes better return per unit of risk taken.
Opportunity Cost
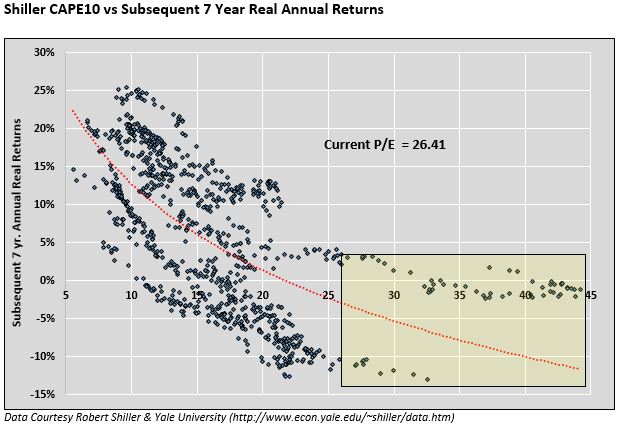
Next we shift focus to two investment options- U.S. equities and foreign sovereign bonds. Many measures of value in the U.S. equity markets are currently extremely elevated. As an example, monthly price to earnings ratio data (CAPE 10 developed by Robert Shiller) is presented in the scatter plot below with subsequent 7 year S&P 500 real annual returns. Higher P/E ratios (horizontal axis) tend to result in lower returns (vertical axis) and vice versa. The current CAPE10 is 26.41. Since 1927, a ratio as high as or higher than the current one, as highlighted in the yellow box, produced maximum annual equity market real returns of 4% for the following 7 years! In the majority of instances returns were actually below 0%! The red trend line forecasts -3% annual real returns for the next 7 years.
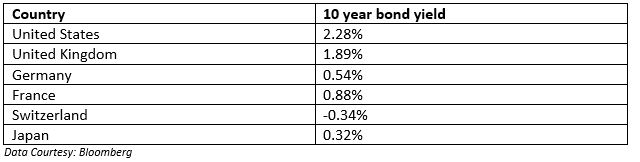
The following table shows 10-year U.S. Treasury bond yields compared to the yields on other liquid, sovereign bonds.
The U.S. dollar plays a major role in determining foreign and domestic demand for U.S. bonds. Please see “The USD Role as a Funding Currency” to read more on how a continuation of U.S. dollar appreciation may increase demand for U.S. bonds.
Conclusion
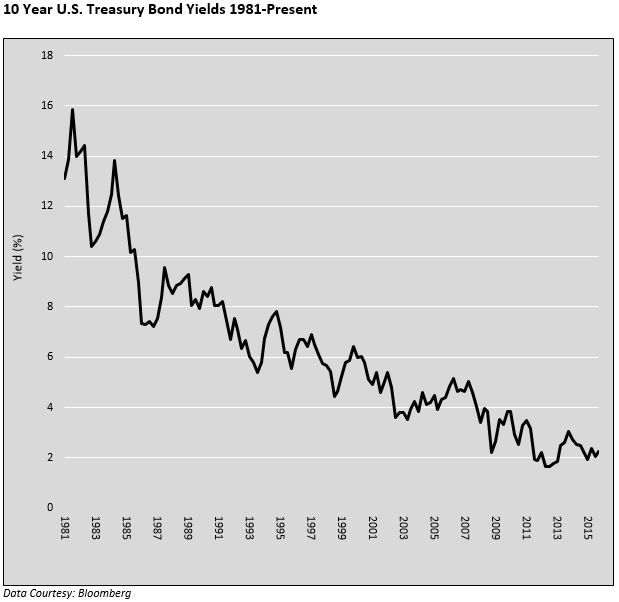
The data above helps further highlight the potential bullish case for U.S. Treasury bonds in the near term. Coupled with the prior article, a strong case can be made that despite very low nominal yields, value can still be found in bonds. We end by showing the consistently declining path of 10 year U.S. Treasury bond yields since 1981. History does not necessarily predict the future but the trend of the last 35 years has been very favorable for bond holders.
Related Posts

Systematic vs. Discretionary Trading: Which Strategy Is Right for Your Portfolio?
Investors face many choices when selecting investments. Historically, the main divide was between fundamental and technical trading. The growth of computer systems for trading has introduced a potentially larger variable that will only increase as AI advances, whether in systematic (rules-based) or discretionary (human judgment) trading. In just my 20 years working in the industry, […]

Futures Commission Merchants Explained
New investors to the futures world often ask, “How does opening an account work?” It is a good question. Unlike traditional brokerage accounts, the rules of margin, how trades clear, and the counterparties involved operate differently. A Futures Commission Merchant, typically called by its FCM acronym, is a key player working between all the various […]

Futures Margin Calls, Explained: Initial vs. Maintenance
A margin call is one of the phrases that scares a new futures investor the most. Often, they picture life savings getting wiped out in seconds, as it does in movies. The truth is not nearly as intimidating. Margin is simply a tool. One that educated investors often love. After all, if you expected your […]