
Commentary by John Knott of Numberline Capital Partners.
As we look back on the year, the program satisfied all the benchmarks we have set for ourselves. Although past performance is not an indication of what is to come, we exceeded our 15% performance target. In addition, we kept our max drawdown under 5%. This year the market spent most of the year transitioning into an inflationary regime which is probably the regime our program will find the most challenging. The reason being is as a market-neutral program, our short side of the ledger is essentially short inflation all the time. So that left us with very few opportunistic opportunities on the short side. But the program weathered this transition well. We expect much more two-sided volatility this year, which should provide plenty of opportunities on both sides of the market.
Last month we left off warning that the technical picture looked awful while the economic data looked good. Not much has changed. After a brief Santa Claus rally, the market has finally become nervous about the Fed and the rise in interest rates. The good news is, there has been a lot of technical damage already. Most stocks in 2021 had a bear market. While a few of the large-cap tech stocks held the indices up. We believe 2022 will continue to see a transition into more cyclical and value-oriented names vs. growth. But, of course, this is the consensus of the market anyway. Which means it will likely be a volatile transition.
We will break down the usual models below and summarize the risk going forward.
Economic Outlook
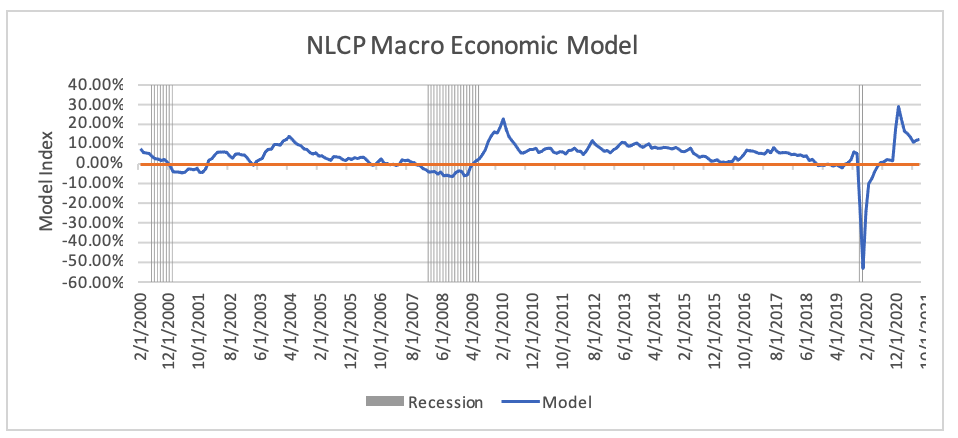
For the second month in a row, the NLCP Model inched higher from 12.15 to 12.56. The avg value over time is roughly 4%, so these readings are still very robust. Consumer spending is still up over 8% year over year. The labor market is very strong, with continued improvements in avg weekly hours, total private payrolls, initial jobless claims. Another indicator we look at is the employed to unemployed ratio. The economy is solidly in mid-cycle. While we are moving faster along this cycle, it appears we are still at least a couple of years away from a recession. Usually, this model turns negative about 9 to 12 months before a recession.
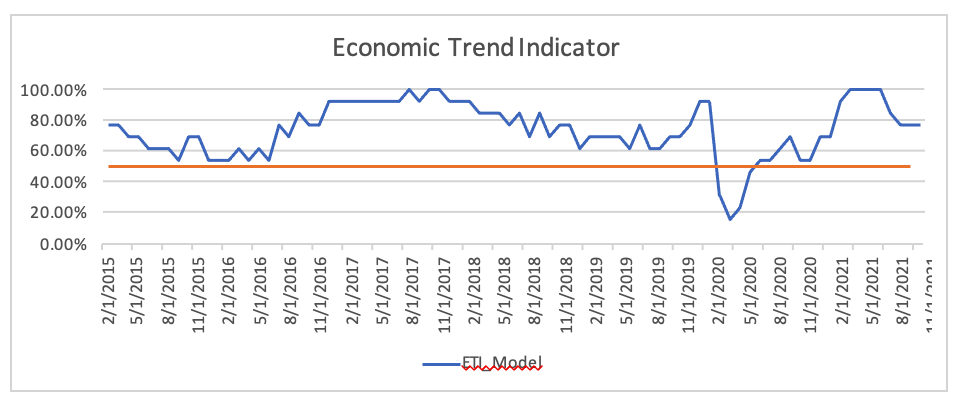
We don’t usually include this graph, but this shows the individual components that go into the model. It shows that 77% of the variables are positive. Usually, when this dips below 50%, the NLCP Economic Model goes negative. So, we watch these things together.
Volatility Risk
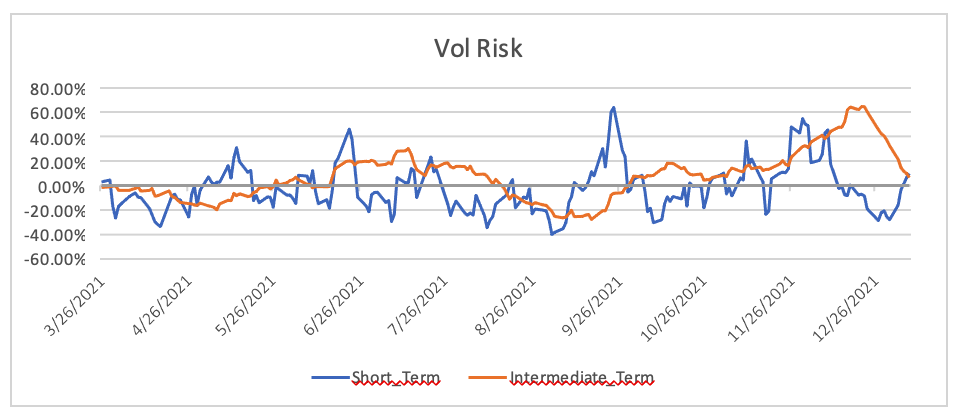
We’ve made some adjustments to our volatility indicator. We now have six inputs. We’ve added both yield curve volatility as well as bitcoin volatility. As bitcoin becomes more adopted by institutions, the volatility in this asset will impact other risk assets as it has for the past several years. The breakdown for this indicator is now; 40% FX vol, 40% interest rate vol, and 20% bitcoin vol.
As you can see, this thing started flashing warning signals in Sept. While equities were not much perturbed by it, volatility in the rate and FX market was at levels we last saw during the peak covid selloff. So, this “disturbance” in risk assets has been going on for four months now and is probably closer to the end than the beginning. The intermediate signal is calming down and the short term is still agitated by the violent re-positioning that has so far taken place the first week of the new year. We probably have another week or two of this re-positioning before things calm down.
Technical Outlook
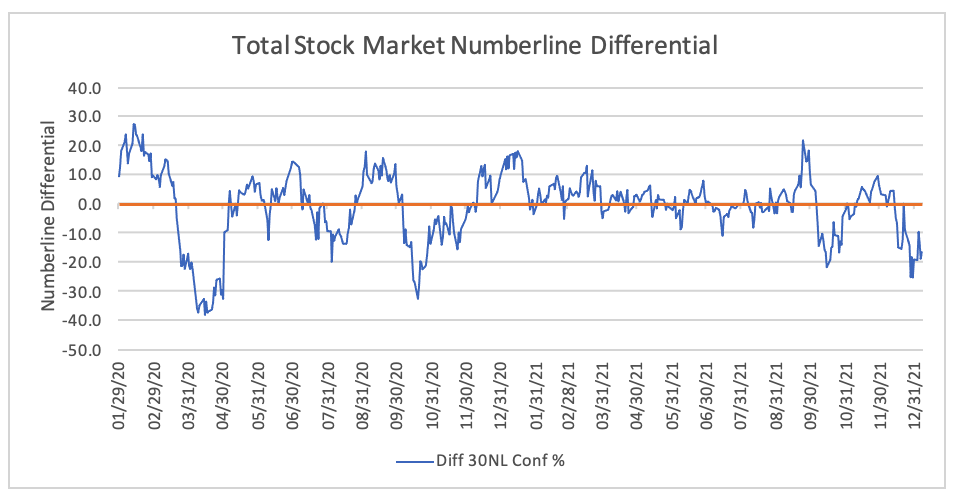
This indicator continues to be awful. This is a list of the internal number line scores for 3,000 stocks. The numberline score is a quantitative score our program gives each individual stock each day based on how the stock trades. The scores are aggregated over the entire database, and we get this output which gives us the internal strength of the market. This has been the same story all year. A few very strong large-cap growth stocks and the rest of the market are struggling, especially the small-cap and value names. We are likely seeing this indicator improve dramatically this year. However, if it comes at the expense of the large-cap names, the overall indices might end up being very choppy at the index level.
The Russell 2k, however, is not diluted by the large-cap problem, and we expect that index to outperform this year.
Summary
The inflation trade has kicked into high gear. That means bonds are weaker, the dollar weaker, the yield curve steepening, and rising commodity prices. This will probably be the story for the first half of the year. Equities will have to transition. By the 2nd half of the year, we could get a nice shot in the arm. As inflation begins to temper down, the “real” levels of growth will increase. That means real margins, real wages, and real interest rates. If you combine this with a more normalization on the Covid front, that is a recipe for the big push into what could be a final explosive late-cycle blowoff into 2024. Also, keep in mind whatever the Fed is going to do this year, they will likely get it done in the first half as not to interfere with the mid-term elections.
Past performance is not necessarily indicative of future results.
Photo by Pawel Czerwinski on Unsplash