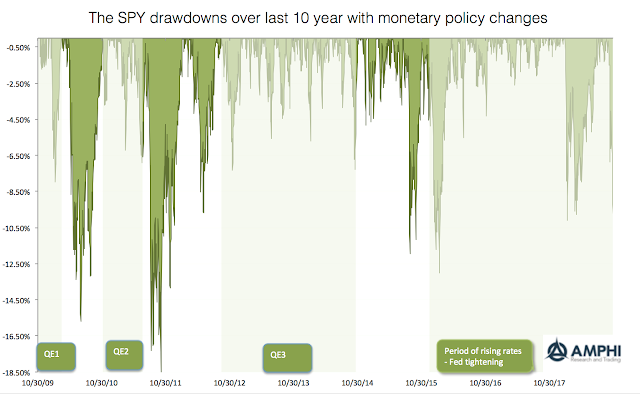
Our graph looks at the drawdowns for the equity benchmark SPY over the last ten years. While the current drawdown has come fast, there are have been a number of drawdowns that have been far worse albeit none that have reached the magic 20 percent market correction level. There is reason to be concerned, but investors need to have perspective.
Nevertheless, we have noticed that the largest drawdowns were associated with periods when the Fed was not generating more liquidity. During the transition period between QE1 and QE2, there was a 15% drawdown. During the transition period between QE2 and QE3, there was an 18+% drawdown. The next four largest drawdowns occurred after the Fed stopped quantitative easing. The periods of quantitative easing were drawdown exceptional because there were no large drawdowns. We are now in a more normal environment, more risk, larger drawdowns, and more uncertainty.
After hundreds of discussions with hedge fund managers, I am still surprised that there is a fear of revealing investment processes under the assumption that someone will steal their ideas and intellectual capital. There are few investment styles that are truly unique and special. What is special is still strategy execution – the practical process of delivering returns. Skill is with the decision-making execution of information and strategy.
All hedge funds are not created equal as the return box chart shows for the post Financial Crisis period. There is a significant amount of dispersion across hedge fund styles. Over the period 2009-2018, the difference between the best and worst hedge fund category is almost 7 percent after we account for global equities and bonds.
The attraction to private equity and other less liquid alternatives is clear from the Guide to Alternatives by JP Morgan Asset Management. The return profile is much higher for private equity and debt funds than more liquid alternatives and global bonds; however, the dispersion in returns is multiples higher than what can be expected from other public categories.