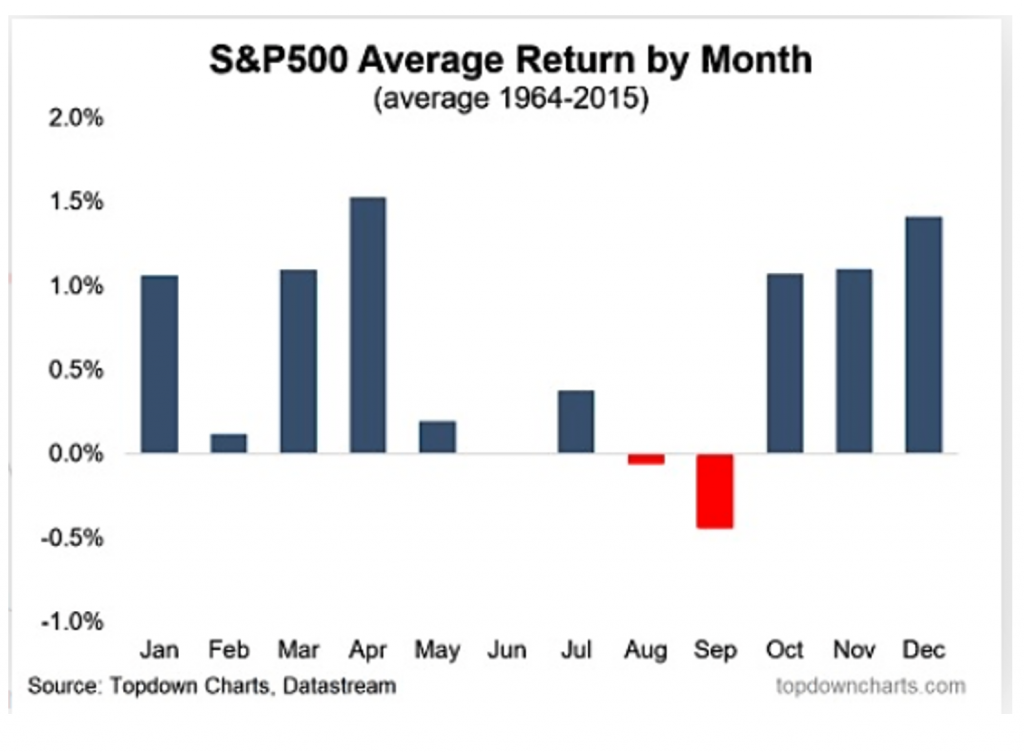
If it seems like September is looking like a rough period for the market you might be surprised but you shouldn’t be. In fact, over the past 50 years, it is the worst performing month of the calendar year. The chart below shows where the saying, “Sell in May and Go Away”, comes from referring to the period from May to October. The good news is that historically it is followed by the strongest quarter of the year. As we are often reminded though, just because something occurred with regularity does not mean it needs to persist.

Hypotheses for this pattern include the idea that many investors go on vacation during the summer months which leads to less trading volume and smaller returns. As we near the end of the year, investment flows increase along with end of year reporting for companies that are trying to make their annual number. This coincides with year end bonuses that ultimately could drive January flows as well. If this seems overly simplistic, you are probably right. After all, October 2008 is still etched in my memory as one of the worst crashes I have witnessed as the housing market collapsed. The more relevant period I am looking at however is December 2018.
Much like today, you had a strong increase in GDP from the previous year. Rates were very low by historical standards and the labor market showed high demand for jobs with increasing wages. The Fed had raised rates three times and then did so again for a fourth time on December 18th, 2018 up to a 2.25% target. There was some concern that a slow down may be occurring and the final increase was met with disaster. All major US stock indices dropped by 8.7% or more that month with the S&P down 13.97% for the quarter. The result was a losing year for all US indices and the worst December performance for the S&P and Dow since 1931.
Currently, we are coming out of a pandemic heading into the end of the year and the Fed is once again at the forefront. The current rate target is 0-0.25% and asset purchases are $120 billion per month. Talk of reducing these purchases has led to more choppiness as we see September struggles across all indices. Adding pressure to their decision is a 5.7% rise in the Consumer Price Index (CPI) from 2020 to 2021. This nears a 13 year high in annual inflation with government proposals of $4.5 trillion in spending still on the table in addition to $2 trillion in stimulus spending earlier this year.
This puts the Fed in a difficult position as Americans feel the effects of inflation while higher taxes are proposed which could further increase the cost of goods and services. A less dovish policy could support dollar strength to decrease this effect. However, while the Fed is receiving plaudits for their handling of the complete closing of our economy and the subsequent recovery, they left themselves little room to maneuver if another crisis rears its head. Reducing asset purchases would be the first step but a market that depends on low rates for success will suffer. Jerome Powell is up for re-election so we might expect cautious moves in the near term.
More recent data already casts some doubt on these patterns going forward. The influx of retail traders into the market has already affected trading volumes and government intervention is playing a larger role than ever. Savers increasingly get pushed into equities and with recent market highs (over the summer no less) we might eventually run out of investors to “buy the dip” at which point we could see big drops. Recently, events in China (again) suggest that their economy might not be on great footing which could lead to more trouble. As always, it is best to be diversified even if it seems like the market goes up all the time. Trying to add insurance during a drop rarely works and February 2020 shows a surprise can come from anywhere.
Please reach out to me if you have any questions or want suggestions on how to balance your risk. Recently, new strategies added to our site aim to capture equity gains while providing a non-correlated component to potentially hedge within the same account.
Photo by Halacious on Unsplash

