“Winter is Coming” goes the famous line from Game of Thrones. In that context, it portended trouble ahead. Perhaps, it could also refer to the stock market to begin the year with the lowest January returns since 2008. A saying says that “As January goes, so goes the year.” The truth is that few are great at predicting market direction over any short-term period. Surprises are part of the game, but we can use the available information to adjust our asset allocation to prepare for various scenarios.
A common misconception is that managed futures only perform when markets go down. This reputation is understandable as some of the best historical periods for the asset class occurred during falling markets. This happens not because traders bet against the market per se but because the directional moves are strongest during a crisis. Equities show this familiar behavior with periods of long grinding gains followed by sharp losses that take months (years) of gains off the table. Volatility is a friend to these strategies.
One could argue that alternative managers have underperformed in recent history as the stock market has skyrocketed. This is true from an absolute standpoint, but this performance is consistent with lower volatility periods following massive government intervention. My view is that a balanced portfolio should always have things going up and down, or it is not diversified. If everything goes up during an equity rally, you can imagine what would happen in a crash. Futures traders and others need to wait for their time when conditions support their outperformance. Perhaps that time is now. I say this for a number of reasons listed below.
Reasons managed futures could outperform
- Inflation – Commodities often benefit from the rise in prices as energy, food, and metals go up relative to a depreciating currency. So called “hard assets” have intrinsic value. The Consumer Price Index rose 7% in 2021 according to the US Bureau of Labor Statistics its largest gain since 1982.
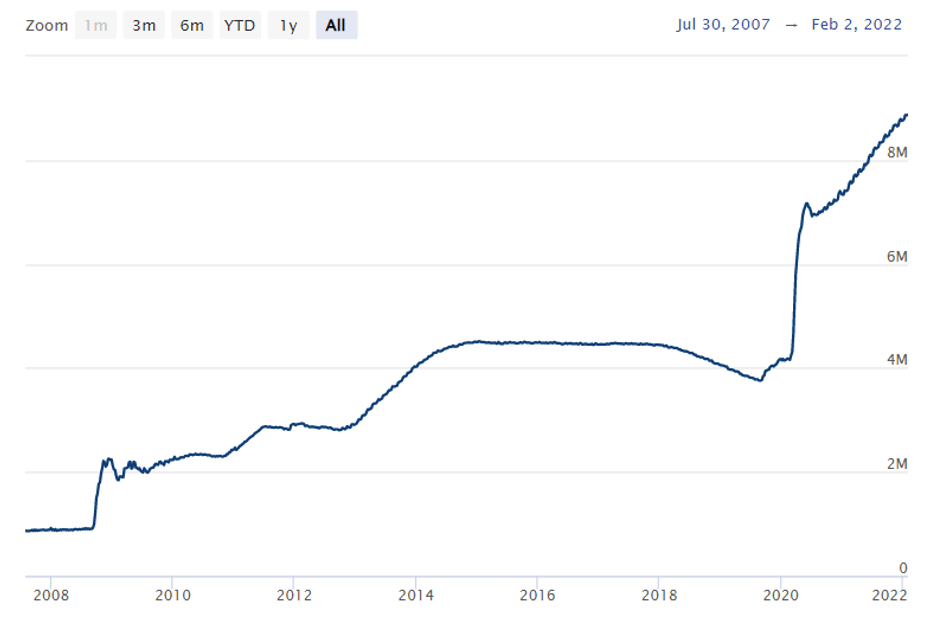
- The Federal Reserve – “The Fed” accumulated massive holdings during the pandemic in a bid to keep interest rates low and liquidity flowing. This succeeded to stabilize the economy but the costs are now coming into focus. We addressed their dilemma in our previous article (The Fed Pickle). The chart below shows just how much they grew.
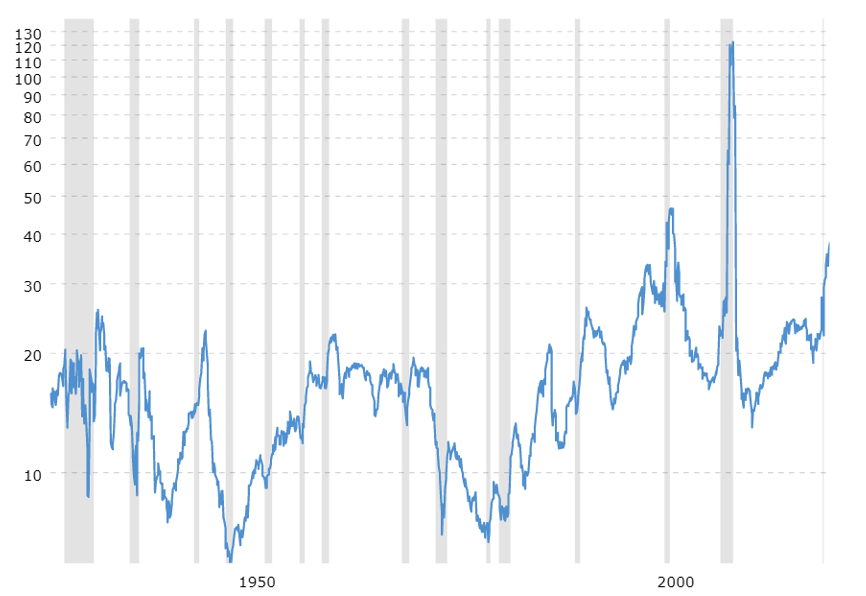
- Company valuations – The price to equity ratio of companies is soaring once again. You can see from the attached chart that these move in waves. The longer it goes up the larger the potential drop. Recession often coincides with the peak and subsequent fall.
- Interest rates – Quite simply, the cost of capital increasing hurts the bottom line as money is diverted to debt servicing instead of hiring, new products, and more.
- Geo-political issues – Two of the largest militaries in the world are threatening their neighbors, Russia in the Ukraine (again) and China towards Taiwan. With President Biden’s popularity fading, they might believe it is an optimal time to act.
- Energy policy – The European Union and the United States both are moving to a zero-carbon future more quickly than the market is showing viability. Restrictions on new drilling, closing nuclear power plants, and a lack of domestic production has pushed both to rely on unreliable partners. Skyrocketing natural gas prices in Europe in the fall show how quickly prices can change. Demand is inelastic and substitutes for oil are not here yet.
Story >> Europe risks running out of gas this winter, US official says
Price to Earning Ratios of the S&P 500
Growth in Assets of the Federal Reserve
I always tell my investors that if you meet an advisor who tells you they know what the markets will do, they should find a new advisor. While we don’t know what to expect, we can see that January showed that the market is more fragile than many thought. In just two years, the Fed doubled its balance sheet and plans to let the $4.5 trillion added mature and not be replaced. These numbers get thrown around enough that they lose meaning, but one trillion seconds is equal to 31,546 years. With that much cash moving through our economy, there will be an impact. Perhaps Winter is Coming. It may be time to make sure your portfolio is ready for the cold.
Please call me if you would like to discuss adding managed futures to your “All Weather” portfolio.
Photo by Thom Holmes on Unsplash


