

DISCLAIMER:
While an investment in managed futures can help enhance returns and reduce risk, it can also do the opposite and result in further losses in a portfolio. In addition, studies conducted on managed futures as a whole may not be indicative of the performance of any individual CTA. The results of studies conducted in the past may not be indicative of current time periods. Managed futures indices such as the Barclay CTA Index do not represent the entire universe of all CTAs. Individuals cannot invest in the index itself. Actual rates of return may be significantly different and more volatile than those of the index.
Managed futures shows good long-term performance versus equities. Yes? No? If you start investing in the SocGen CTA index in 2000 and compare it with any end year until 2015, you will see positive returns as a stand-alone investment. However, if you compare it with the SP500, you may draw very different conclusions. When you start and when you end the investment is critical for performance. Investors know this, but sometimes showing the impact is stark and has a jarring effect on asset allocation thinking.
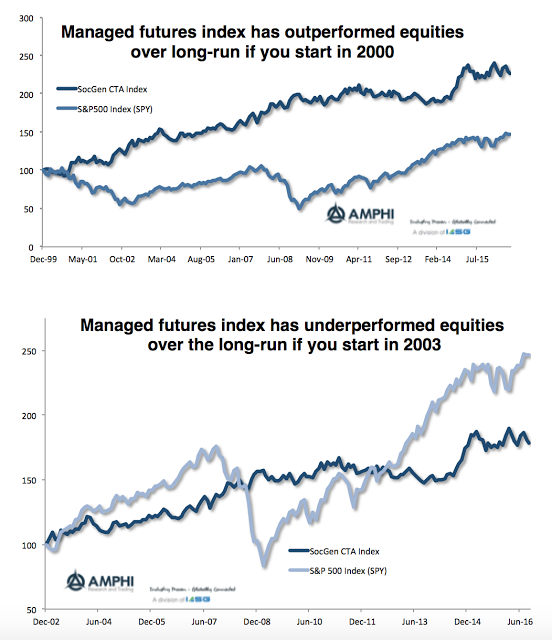
Let’s look at two different charts. The first chart shows performance from 2000 through 2015 for the CTA index and for the SP500 (SPY) index. The second chart compares performance from 2003 to the end of 2015. Which graph suggests whether managed futures are a good investment? Start in 2000 and managed futures are a champion performer. Start in 2003, and you may have to ask why this should be in the portfolio. Start investing in 2000, and you include the fall in tech stocks. Start investing in 2003, and you are including the stock recovery. These extremes make the point that timing matters and show the value of managed futures if invested at the right time. Invest when times are turning bad, and you have a great investment. Invest when the equity cycle is turning up, and you will be disappointed on a relative basis. This is, of course, not looking at diversification but just return performance. The investment may underperform, but there can be strong diversification gains.
Of course, most investors know that the start and end date problem exists, but there usually is not a lot of focus on the when and how long question through studying various investment horizons. Certainly many marketers, if given the chance, will select periods of good performance. This is one key reason why all track records since inception should be presented. However, there may be a more important lesson. Knowing when to add or subtract allocations is critical even for long-term allocation decisions.
We have provided three simple tables that reduce all of the start and end date performance information into an easy to read format. Use the vertical date as the start period and the horizontal as the end period. An investor can see what the performance for any time length or any start period and end period. The diagonals can show what a one-year or n-year investment will look like with different start dates.
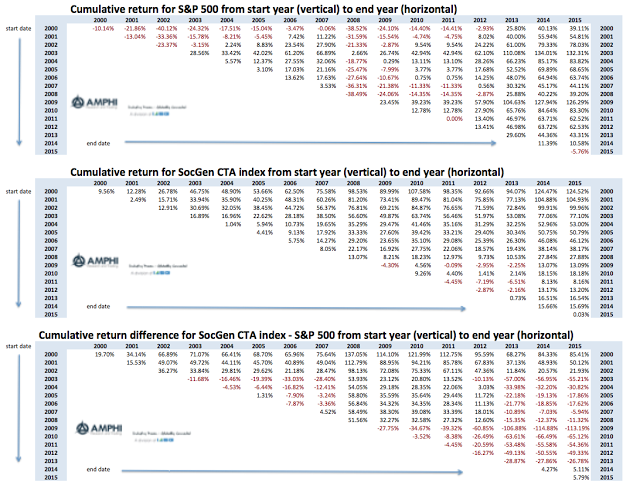
The performance numbers in context are very interesting. These numbers are more extreme since we are looking at cumulative returns and not annualized returns. Managed futures will generally make money for any horizon except for few years during the post-Financial Crisis period. The returns are for an index. Individual managers may do better or worse.
Managed futures will not do as well on a relative basis when equities are coming out of a trough. You can see that with the 2009-2013 start-date vintages or 2003-2004 start-dates. If you look through long-term cycles, buy and hold for equities is positive, but if you have cash flow needs over shorter horizons managed futures can be helpful.
Photo by Thom Holmes on Unsplash