
Market sentiment is a broad term that encompasses the prevailing feeling that investors have about a market. Measuring this “feeling” can be accomplished in a variety of ways. CNNMoney has a Fear and Greed Index that displays this in a simple format showing when investors are most willing to take on risk or hunker down. Modern takes for this type of strategy will take keyword data from financial press articles, interviews, or Twitter trends to make investment decisions as well. Some of these firms use Artificial Intelligence (AI) to parse this in real time to place trades across all markets. How can average investors use this to their advantage though?
I believe that Warren Buffet’s famous adage, “Be fearful when others are greedy and greedy when others are fearful” is one that investors should follow. Quite simply we should be wary of overpaying for an asset in high demand and interested in buying something below market. This sounds easy in theory but is not how most people make choices. Knowledge of where we are on the Fear Greed continuum or at least awareness of the risks in the current market cycle can prepare us for the “surprise” that hits everyone else. Understanding why markets function like this is important as well.
A pattern that is familiar to many of us is a typical product lifecycle. Television sets have a predictable price pattern. Samsung releases the newest 8k TV. Early adopters get the first sets, followed by the masses, and finally the stragglers who finally buy one as it hits clearance because 16k technology has replaced it. Prices start high and then as interest wanes prices fall slowly at first and then quickly. When nobody is left to buy price support collapses without anyone to buy the remaining inventory.
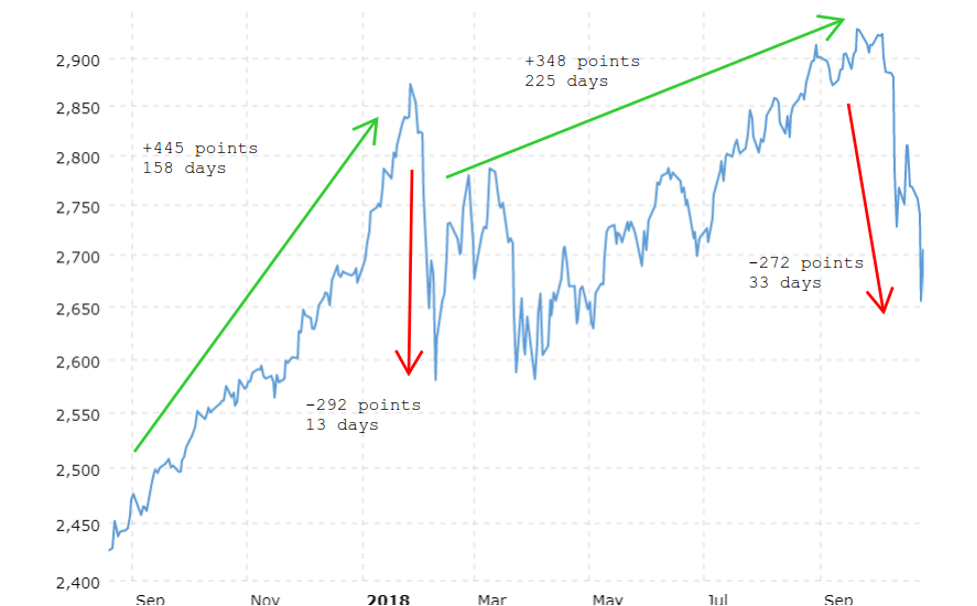
Commodity and financial markets follow a similar pattern. Markets go up slowly with building momentum as the fear of missing out pushes even the most cautious investor into the market and then we drop. Take a period from mid-2017 (shown below) as the S&P raced to an all-time high only to give back 65% of the gains in just 13 days (including weekends). It then recovered over the next eight months only to give up 78% of those gains in the next 33 days. Each time this happens we can identify a catalyst but just like the television example as the market reaches lofty heights we start running out of buyers. So when the market stops dropping there isn’t a large pool of capital to enter to support the market. Instead the S&P falls until the selling ends and an equilibrium price is reached.
An investor is therefore faced with two choices, they can try to time the market or they can build an “all weather portfolio” that uses asset classes with different return drivers to balance this risk. The latter option might include some investments that are hard to watch over long periods but might make up for it in just 13 days. So here we sit again at record highs, the vaccine is being distributed, and a new Congress is ready to provide even more stimulus. Should we be greedy or afraid?

Please email or call me if you would like to learn more about traders that use Sentiment in their trading or programs that could potentially help create a more balanced portfolio. I can be reached at gtaunt@iasg.com or 847-877-0887.
Examples of indicators below.
| Traditional Sentiment Indicators | Modern Sentiment Indicators |
| Overbought | Social Media |
| Oversold | Web Traffic |
| Stock Price Momentum | Payment Information |
| Price Strength | Satellite Data |
| Price Breadth | Real Time Trading Flows |
| Put/Call Ratio | Crowd Sampling |
| Junk Bond Demand | Live Interview Parsing |
| Market Volatility (VIX) | Financial Press |
| Safe Haven Demand | Comment Monitoring |
| Volume | |
| Odd Lot Trading Statistics | |
| Commitment of Traders report |
Related Posts

Race to Nowhere: Markets Pause Before the Next Big Move
Running on a treadmill is one of my least favorite activities: you expend a lot of energy but end up exactly where you started, only out of breath. So far in 2026, financial markets are behaving similarly. There’s intense activity, but the major indices have gone almost nowhere. As of mid-February, the S&P 500 is […]
Systematic vs. Discretionary Trading: Which Strategy Is Right for Your Portfolio?
Investors face many choices when selecting investments. Historically, the main divide was between fundamental and technical trading. The growth of computer systems for trading has introduced a potentially larger variable that will only increase as AI advances, whether in systematic (rules-based) or discretionary (human judgment) trading. In just my 20 years working in the industry, […]

The Evolution of Trading from Systematic to AI
Is AI the next step in the evolution of trading? History proves new tools storm the markets, then high adoption erases their edge. What can futures trading history teach us about AI’s trajectory? The 1980s: Rise of Rules-Based Trading Building on simple regression models that aimed to identify patterns across sectors, the 1980s showed that […]