

Inflation fell according to the last CPI (Consumer Price Index) report in the United States, setting off a furious 5% rally in equities as Fed policy finally takes hold. However, according to Forbes, prices increased 0.4% month over month, bringing the rate down to 7.7% on an annualized basis, which they believe is reason to cheer. But is this the “good news” it is purported to be? Understanding what this number tells us is important as we plan our investment strategy for the future.
A key part of identifying return drivers for managers is evaluating environments that coincided with winning or losing periods. Key events such as the 2008 Financial Crisis, the 2010 Flash Crash, and the so-called “Volmageddon” in February 2018 provide working examples of risk management and opportunities for outsized returns (or losses). In much the same way, we can identify critical events that affect the current inflation rate. Below is a short list of key contributors.
- January 2020 – COVID identified as a public health concern
- December 2020 – Emergency use approval granted for the COVID-19 vaccine in the United States
- March 2020 – CARES Act Passes, which includes $2.2 trillion in stimulus checks, government aid, and loan programs for businesses
- December 2020 – Consolidated Appropriations Act of 2021 authorizes $600 billion in stimulus checks
- January 2021 – Joe Biden assumes office as President of the United States
- March 2021 – American Rescue Plan Act of 2021 passes (proposed January 14, 2021) which includes $1.9 trillion in economic stimulus
- February 2022 – Russia Invades Ukraine
Using the chart below, we can see that the Consumer Price Index fell almost 1% from March to April 2020 following the spread of COVID. Massive stimulus then passed in March 2020, supporting an overall inflation gain of 1.4% for the year. The vaccine’s approval in December 2020, combined with a committed stimulus of $2.5 trillion in less than three months, coincided with a rapid 4.8% increase in inflation through the first seven months of 2021 and a 7.5% total for the year. This pace continued in 2022, pushed along by the Russian invasion of Ukraine. In totality, the inflation index increased by approximately 14% from January 2021 until October 2022.
| Year | Jan | Feb | Mar | Apr | May | Jun | July | Aug | Sep | Oct | Nov | Dec |
| 2022 | 281.148 | 283.716 | 287.504 | 289.109 | 292.296 | 296.311 | 296.276 | 296.171 | 296.808 | 298.012 | ||
| 2021 | 261.582 | 263.014 | 264.877 | 267.054 | 269.195 | 271.696 | 273.003 | 273.567 | 274.31 | 276.589 | 277.948 | 278.802 |
| 2020 | 257.971 | 258.678 | 258.115 | 256.389 | 256.394 | 257.797 | 259.101 | 259.918 | 260.28 | 260.388 | 260.229 | 260.474 |
| 2019 | 251.712 | 252.776 | 254.202 | 255.548 | 256.092 | 256.143 | 256.571 | 256.558 | 256.759 | 257.346 | 257.208 | 256.974 |
| 2018 | 247.867 | 248.991 | 249.554 | 250.546 | 251.588 | 251.989 | 252.006 | 252.146 | 252.439 | 252.885 | 252.038 | 251.233 |
| 2017 | 242.839 | 243.603 | 243.801 | 244.524 | 244.733 | 244.955 | 244.786 | 245.519 | 246.819 | 246.663 | 246.669 | 246.524 |
| 2016 | 236.916 | 237.111 | 238.132 | 239.261 | 240.236 | 241.038 | 240.647 | 240.849 | 241.428 | 241.729 | 241.353 | 241.432 |
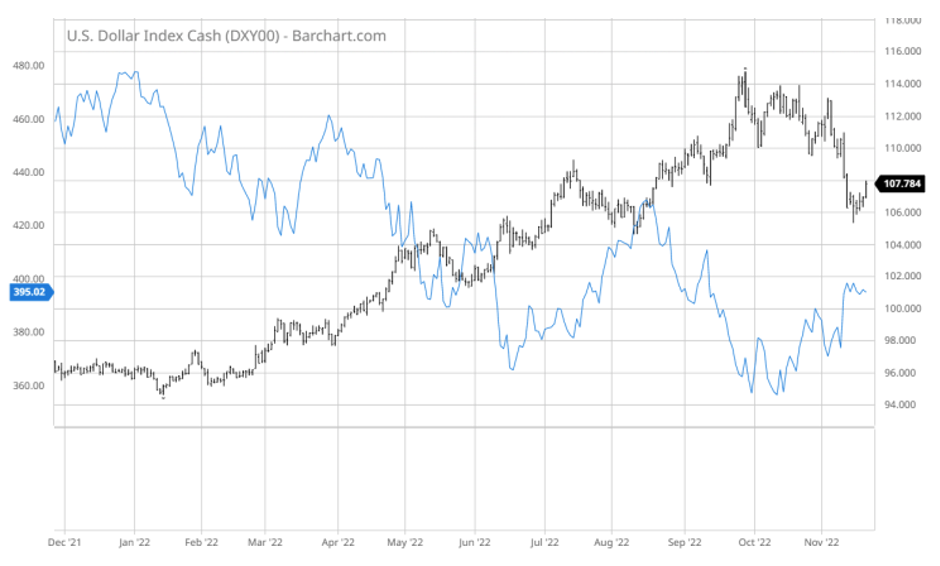
Throughout this entire period, inflation only hit 9% for one month before declining back into its 7-8% range. However, it is important to remember that this is an annualized number. As we progress month to month, the previous year’s data is replaced. When we analyze the numbers in this light, we see that October 2021 was up 0.83% (a particularly large month), so naturally, when that number got replaced by a 0.4% increase in October 2022, the annual growth rate declined. The rapid increases of early 2022 will provide the Fed with opportunities to claim victory as the February and March growth rates of 0.91% and 1.34%, respectively, drop off. The strength of the US dollar is an under-reported mitigator to the benefit of the United States, which is beginning to wane and could affect this trajectory. The chart below shows the US dollar versus a basket of other currencies. Not to be overlooked, the blue line indicates the S&P index, which is running with what I would charitably consider a pretty dramatic negative correlation.
Ultimately, the current prices should remain elevated, but we can hope they will stop going up so quickly. As higher wages become entrenched and consumers become used to the new levels, retailers will not be incentivized to reduce any time soon. Sadly, a recession is the cure for this situation. Layoffs at Amazon, Facebook, and others indicate that cracks are forming. Housing prices could be the proverbial “canary in the coal mine” as home prices fell 1.6% according to the Case-Shiller US Price Index between July and August alone, and investor activity in the sector already dropped 20% from this time last year. The first monthly decline since 2012. Whatever the outcome, trading opportunities should persist, and 2023 should be another fascinating year.
Note: I recognize that inflation is an issue internationally as well. A combination of COVID policy, stimulus, and central bank action form the core reason for much of this, with country-by-country differences. This article focuses on the United States as the world’s largest economy and, therefore, an outsized influence.