Archives

Six Keys To Trading A Commodity Trading Advisor Knows That You May Not…
Most professional CTA’s look and think about trading in a much different way than an average trader or investor would, and the reason for this is not hard to understand. If a CTA is successful what it means to me is that they have dedicated their lives to the craft. Every trader wants to be […]

Are You Interested in Becoming a Commodity Trading Advisor?
Services for CTAs Grow Your Business With Us You’re busy honing and perfecting your trades and strategies; you don’t have a lot of time for client acquisition or back office management. IASG can help. List your programs FREE on IASG.com and you’ll be introducing yourself to thousands of potential new customers and partnering with an […]

Start of Something Bigger in the S&P 500?
S&P Index futures fell by 1.11% today currently trading at 2105.50 lower by 19.00 points for the session, hitting a fresh 7 day low. The main talk amongst the trade were concerns about Greece and some positive economic data which again fueled expectations that a U.S. rate hike is coming sooner than later. How many times […]
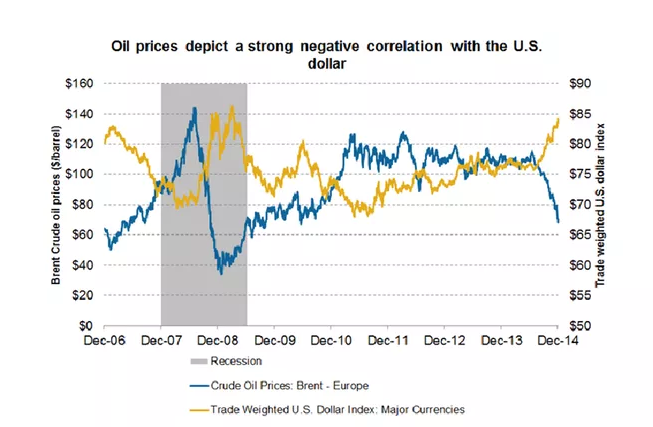
Don’t Be Fooled by Oil Bull Talk
Written by: Bryen Deutsch The 200-day moving average is a widely held long-term trend indicator. Markets trading above the 200-day moving average have a tendency to be in longer term uptrends. Markets trading below the 200-day moving average tend to be in longer term downtrends. Last July, the US Dollar Index crossed above the 200 […]
Soybeans: Will the Free Fall Continue?
Soybean values traded lower across the board today, with July 15’ settling at 9.22 ½ off 1 ¾ cents (New contract lows). Corn also showed weakness today, closing down 5 cents at 3.55, with Wheat values plummeting 21 ¾ cents, closing at 4.93 ¼, pegging in a new seven-day low. Rains continue to fall, which […]

Walmart Becomes Farm Friendly
Click the Link Below to watch the Full Story… Click Here

Oil’s Inside Week Suggests Imminent Breakout/Breakdown
Written by: Bryen Deutsch Last week both WTI crude and ICE Brent crude traded within the previous week’s range. This inside week was choppy and fairly uneventful as a second consecutive inventory draw reported by the EIA failed to drive the market to new highs. The chop fest continued Monday as the market closed slightly lower […]
The Advantages of Professional Traders in the Futures Market
I know a lot about grains. In fact, I know much more than the average person about energies, metals, currencies, softs, and financials. I would never try to trade any of them for customers for a simple reason. I know others who have done nothing for most of their careers except focus on each area. […]
Corn Values Remain Stable after Report
Corn: (July Corn Futures) – Values managed to edge higher by ½ cent on today’s session, settling at $3.61 even after the USDA analysts chose not to upwardly adjust new crop yield estimates leaving them at 166.8 bu/acre. This is the second-highest yield now on the books, however, the trade may see this as a […]
Understanding the Long Put Option: Advantages, Disadvantages, and Trading Steps
Buying (Long) a Put Option:A basic options strategy to be familiar with and learn the advantages and disadvantages of is Buying a Put Option (Long Put). Buying a Put option is the opposite of buying a call option in that a Put gives you the right, but not the obligation, to sell the underlying futures contract at a specific […]
How do you use Basis to Hedge?
Cash Price – Futures Price = Basis (at a specific point in time) A producer’s decision as to when and how to market their crops or livestock can have as significant an impact on their net bottom line profit as any production decision they may make throughout the year. Farmers today have more marketing alternatives […]
Overcoming Mental Blocks to Investing: Part 2
In my previous article, we reviewed the first seven of 13 “mental blocks” to investing an average CTA or investor may butt up against throughout trading or investing. To continue from where we ended off in the previous commentary, we will cover the final six biases and blocks that may affect how a CTA tests […]
Quiet Session in Soybeans. Calm Before the Storm?
A tranquil session today in the soybean market, with soymeal taking a backseat to oil. The nearby soybean spread May 15 vs. July 15 strengthened even with abundant total U.S. supplies in the picture. We have now seen Chinese imports lagging the year-ago pace for the last three consecutive months, with the cumulative seven-month import […]