
Markets often communicate more clearly through price action than through headlines. The dramatic surge in metals contracts is sending a powerful signal, but what exactly is it telling us?
Traders frequently monitor inter-market relationships for early warnings. When one asset class moves unusually, it can ripple across the system or reveal deeper structural issues. In October 2025, we highlighted Gold’s Resurgence, unaware at the time that the move was only beginning. Today, we examine whether this rally reflects normal supply-demand dynamics or something more systemic.
Unusual Cross-Market Behavior
Precious metals typically rise when investors seek portfolio hedges and reduce dollar exposure, a classic fear trade. Industrial metals like copper, by contrast, usually weaken when growth expectations soften. Yet recently, all major metals have surged, with silver and palladium leading the charge and even copper accelerating sharply.
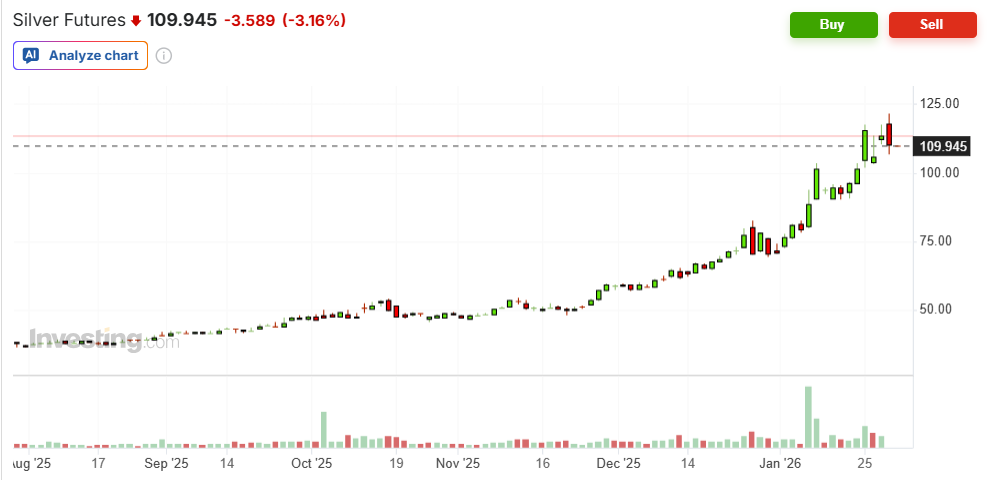
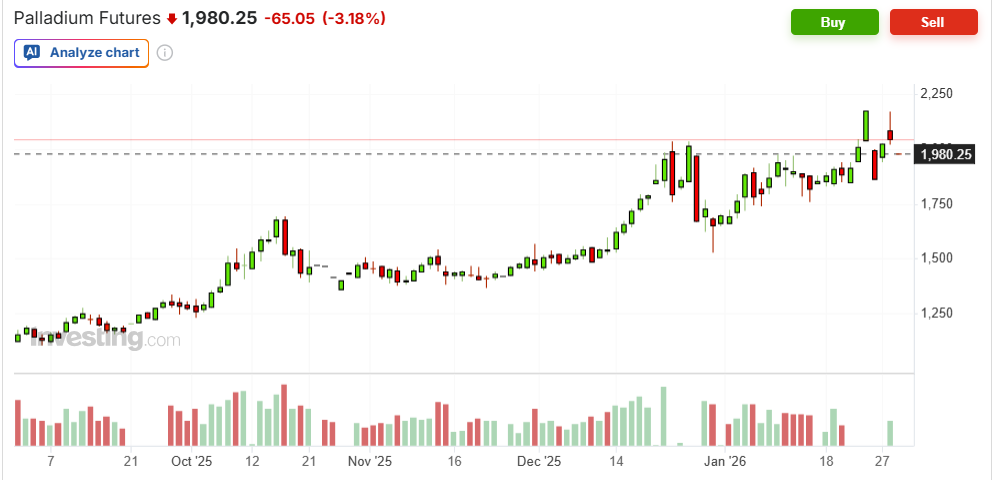
Performance since December 1, 2025 (to late January 2026)
- Silver: +110%
- Palladium: +37%
- Platinum: +54%
- Gold: +24%
- Copper: +16.5%
What’s Driving the Move
Demand
Voracious demand for metals for electric vehicles, battery storage, clean energy, and new data centers continues unabated. McKinsey estimates that $6.7-$7 trillion will be om computing power expansion, with over half in the United States. A large AI-focused facility can draw 20-100 megawatts (MW) continuously, enough to power tens of thousands of homes.
A cursory look at the tonnes of metal needed for each MW gives a glimpse of the massive scale needed for each project. Note that tonnes refers to metric tons, which is 2,204 pounds, so a small AI setup of 20 MW could require 1-1.5 million pounds of copper. This does not include any metals for the actual generation of power.
| Major Metals per MW (AI Data Centers) | ||
| Metal | Tonnes per MW (approx.) | Primary Use |
| Copper | 25–30 (range: 12–33) | Structural frames, supports, and towers |
| Aluminum | 5–15 | Racks, enclosures, some busbars/cooling |
| Steel | 50–200+ (variable) | Structural frames, supports, towers |
While the AI boom is metal-intensive, the global energy transition dwarfs it in scale. EVs are projected to consume over 10× more copper than data centers, and solar already accounts for over 50% of industrial silver demand and 20% of aluminum usage for grid expansion.
Buying by central banks of precious metals continues a trend of diversification away from US Treasuries and the dollar. Trade tensions with Trump exacerbate this effect. The World Gold Council estimates that 863 tonnes moved to sovereign balance sheets in 2025, roughly 20-25% of annual mine production.
Supply
Can our miners keep up with the demand for metals? The short answer is no. Beyond the sheer volume needed, many of the producing countries carry elevated geopolitical and operational risks
- Democratic Republic of Congo (#2 copper producer, 14% global share) — rebel-controlled regions, widespread child labor
- Russia — ongoing sanctions despite continued exports of copper and silver
- China — dominates >60% of global silver refining and maintains trade ties with sanctioned countries
Deficits between production and consumption will expand in 2026 for most metals, except gold. Silver continues its five-year and counting shortfall, and copper moved into a deficit in late 2025. With the explosive demand shown above and an inability to expand production quickly, current prices might reflect a future supply squeeze. Instability in supplying countries could improve or deteriorate further. In either case, it will take a prolonged period of elevated prices for producers to meaningfully expand.
Non-Economic Drivers
Fear of missing out can drive frenzies in all asset classes. We see this effect waning in cryptocurrencies (for now). Trend followers in the CTA space often identify these trends early and ride them until they end, pushing valuations higher. Political developments are also at play.
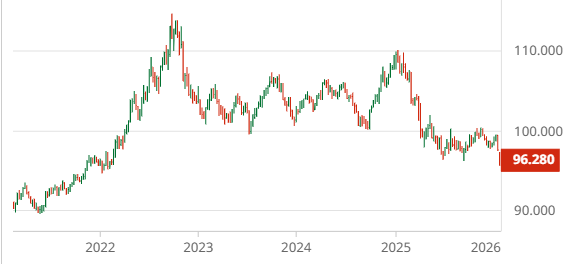
Fear of the United States taking over Greenland by force might prompt further exit from US interests. The debate over replacing Chairman Powell at the Federal Reserve also damages the credibility of a stable currency. Trump may be encouraging this out of a desire for a weaker dollar to encourage exports. The US dollar chart supports this idea as a strong downtrend appeared in conjunction with his inauguration.
US Dollar Chart
Unrest in Iran creates a credible threat to regional stability in the Middle East. Even bad regimes can be predictable ,but the vacuum left over if Khamenei is removed could affect the whole region. Adding to the misery in Iran, the collapse of Bank Ayandeh, an institution with $5 billion in assets, led to money printing to cover liabilities that were transferred to state-run Bank Melli. Reports of massive inflation, which was already running over 40%, further demonstrate the value of hard assets.
Conclusion: Opportunity or Warning?
Time will reveal whether this metals rally proves sustainable. The convergence of AI infrastructure, the energy transition, and de-dollarization trends suggests a new era of structural demand. Yet with equities once again at all-time highs, history cautions against complacency. Bubbles form for a reason.
As always, a diversified portfolio with the flexibility to go long or short remains the most prudent approach.
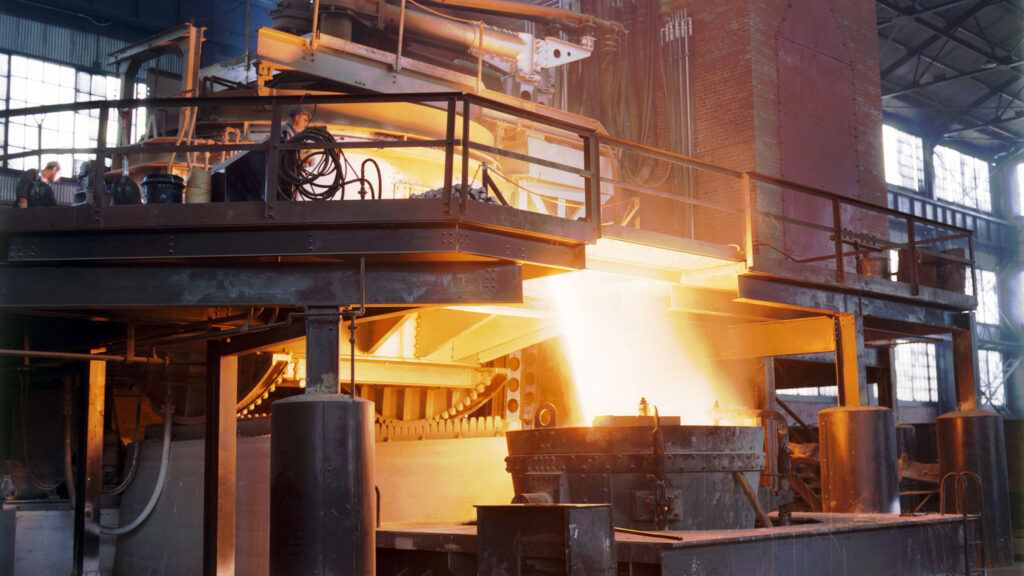
Image: Library of Congress, Prints & Photographs Division, FSA-OWI Collection
Related Posts
Iran, Venezuela, and the New Global Oil Order
Recent events remind us that balance in energy markets can be delicate. A conflict in the Middle East and the removal of a sitting President in Venezuela resulted in sharp moves across the energy industry in early 2026. Currently, the Iran War is creating havoc in crude shipments, affecting the world. While trouble in that […]

Race to Nowhere: Markets Pause Before the Next Big Move
Running on a treadmill is one of my least favorite activities: you expend a lot of energy but end up exactly where you started, only out of breath. So far in 2026, financial markets are behaving similarly. There’s intense activity, but the major indices have gone almost nowhere. As of mid-February, the S&P 500 is […]
2025 in Review: Markets, Policy, and the Path Forward
History never repeats itself, but it often rhymes. This is even more so the case this year, as Trump began his second term with similar but different disruptions to the markets. Rising stocks, normalizing inflation, and the AI boom took center stage. We discuss some of the key events below and try to anticipate where […]