
The spider chart is an alternative way of displaying data that may be useful at showing the strong diversification benefits versus different asset classes and alternatives. Correlations are looked at through a matrix form but the spider or radar graph may better display the most relevant information. Each node on the web may represent a different asset class and show the correlation of each to a single strategy.
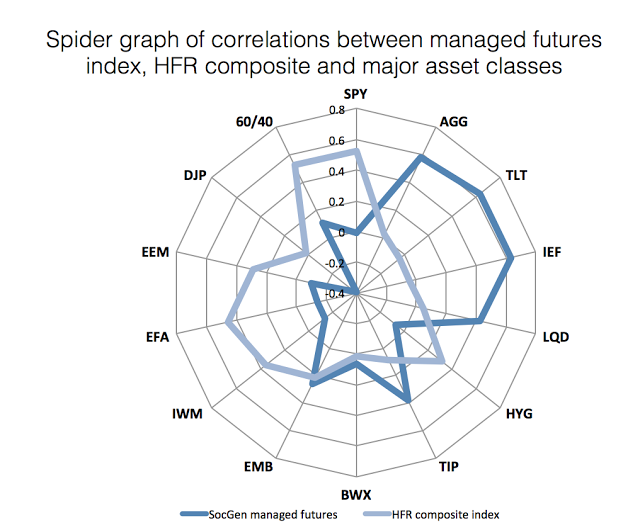
The spider graph provides a simple holistic picture of diversification benefits for a single strategy as well as a group. In the graph above we should the correlation of the SocGen management futures against a battery of other asset classes. Any other alternative can be overlaid on top of managed futures to show the relative performance. We have taken the spider graph which looks at managed futures across different asset classes and enhanced it through running a comparison with a general hedge fund exposure through using the HFRI composite fund of funds index.
The spider shows that managed futures provide a great deal of diversification against equities and less against bonds. The HFRI composite does just the opposite. This shows the relative important of managed futures even within a hedge fund portfolio.