
Asset allocation changes are often associated with the pain faced by investors. When there is financial pain through loses, allocations change, so it is important to know where are the pain points. Pain points can be associated with book value loses. Look at when money flowed into an asset class and the price associated with that flow.
For the current issue, we can look at bond flows each year and the average yield during that year. Assuming an average duration, the total return gain or loss for a given year can be found. Running a simple analysis shows that 2009 and 2013 were difficult years for bond investors, but other periods since the Great Financial Crisis were positive.
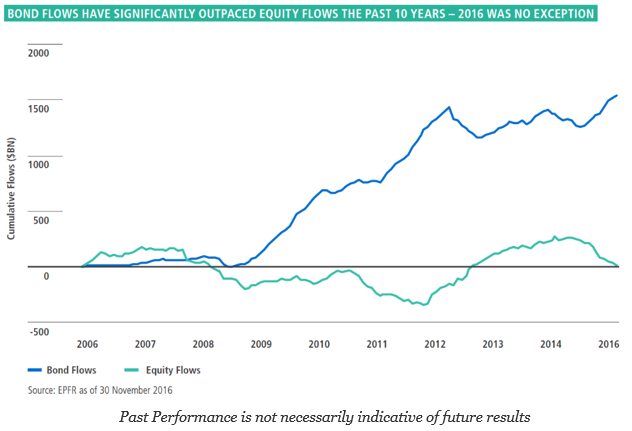
If we look at bond flows, there were no net increases between 2012 and 2016, so most of the investors are still above water on a book value based on when they may have bought their bonds. Simply put, tracking bond flows suggest many new bond investors have not faced enough pain to readjust their portfolios. Rates will have to increase to 2.75% or higher to get the majority of bond flows invested post-crisis to fall below book value. That was the 10-year yield at the end of 2011 when bond flows peaked. The 10-year yield at the end of 2009 and 2010 were both greater than 3%.
This is a simple analysis, but tries to focus on the key decision of when investors will be sellers. The CFTC commitment of traders provides useful information on market tilts, but speculative traders have a different pain threshold and it is real money account flows that may have a greater impact on yields.
For equities, the flows have been flat since before the Great Financial Crisis. This suggests that the equity markets are less likely to be viewed as being at market extremes. There is little new money that is at risk of falling below book value. Many have not participated in the market upside.