IASG, Author at IASG
Bonds – Is Credit Growth Hitting its Limits?
In “Bonds – More Than Meets the Eye”, we proposed that despite historically low interest rates there may be opportunities in Treasury Bonds to earn total returns well in excess of their current low yields. In this article, the second installment of a three part series, we analyze some important factors which help determine where interest rates might be headed in the near term. This article focuses on the demand side of the supply/demand curve to understand pricing pressures. Part 3 of this series will emphasize the supply side of the curve and key determinants of interest rates including economic growth and inflation.
Bonds – More Than Meets the Eye
When buying equities, some investors plan for a short holding period, seeking to capitalize on short-term price fluctuations – “a trade”. Others plan on a longer holding period based on economic or fundamental analysis – “a long-term strategic investment”. Regardless of which tactic is employed, few schedule a specific day, month or even year for divestiture. Contrast this with the bond investor’s strategy, whereby many bondholders seek to hold their investment to its maturity date. Those bond investors possessing this predilection are likely unaware of potential opportunities that trading bonds offers. In this era of historically low yields the opportunity for outsized returns may be significantly larger than current yields advertise if one considers selling a bond prior to its maturity.
Commodity Prices and the U.S. Dollar
The chart above plots the performance of the Commodity Research Bureau (CRB) index, a benchmark measuring the prices of 19 diverse commodities. The legend is purposefully omitted so that we may pose the following question: If the lines represent one indicator, why are there 3 lines? The answer lies not in the commodity prices underlying the index, but in the currency used to express the prices. The blue line represents the CRB index as it is commonly expressed, in U.S. dollars (USD). The green line is denominated in euros and the black line in Brazilian reals. This graph highlights that the currency in which a commodity is denominated can have a meaningful effect on prices.

WEO: Adjusting to Lower Commodity Prices
Global growth for 2015 is projected at 3.1 percent, 0.3 percentage point lower than in 2014, and 0.2 percentage point below the forecasts in the July 2015 World Economic Outlook (WEO) Update. Prospects across the main countries and regions remain uneven. Relative to last year, the recovery in advanced economies is expected to pick up slightly, while activity in emerging market and developing economies is projected to slow for the fifth year in a row, primarily reflecting weaker prospects for some large emerging market economies and oil-exporting countries.
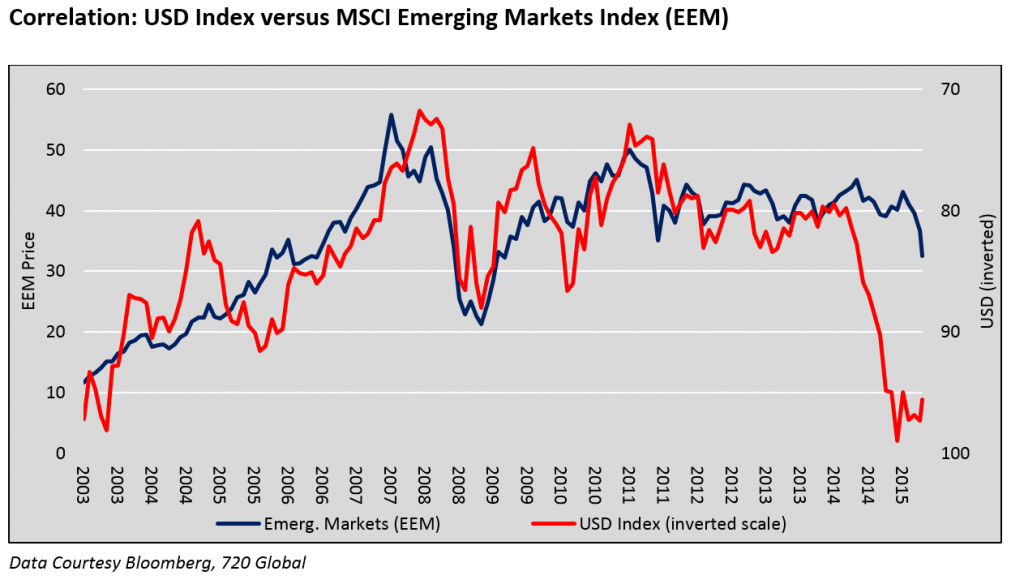
The U.S. Dollar and the Emerging Markets
Historically, periods of USD appreciation have led to outflows of investment dollars resulting in economic hardship, crisis and even regime change in emerging market nations. The 1997-1998 Asian crisis, the related default of Russia and the collapse of the hedge fund Long Term Capital Management, for instance, were precipitated by a strong USD and a rapid reversal of capital flows from Asia back to the U.S. It is estimated the crisis resulted in the repatriation of $250-$500 billion.
The USD Role as a Funding Currency
Over the past year, the real trade-weighted U.S. dollar (USD) index increased over 10%, fostering a slowing of global economic growth, increased volatility in financial markets and plummeting commodity prices. This serves as a reminder of the influence the USD has on global trade and asset markets. Periods of dollar appreciation, as highlighted in the graph below, are not well understood by the investing public as there have been only two major appreciation periods since the removal of the gold standard in 1971. The potential consequences from a third major USD appreciation can have a significant effect on expected asset class returns.

The “New” IASG
For the past several months, IASG has been in the process of updating the aesthetics of our site. To do this properly, we conducted an IASG user questionnaire to get a better sense of what users liked, disliked, and wanted to see more of…For the most part, feedback was incredibly good. Users loved the functionality […]

July Results showing good month for Managed Futures
The IASG CTA Index has approximately 75% of managers updated through July performance with almost all sectors posting positive returns for the month. The one exception is the agricultural index where many managers struggled with grain pricing continuing downward pricing and many with expectations that there would be a bounce back in grains.
Kottke Commodities – Little U.S. Business in Wake of Flood Rally
Between late June and end-July, U.S. agricultural prices traced an extraordinarily wide and rapid boom-and-bust, wild even for futures markets. The managers felt well-positioned in corn bullspreads, which did little despite the sharp changes in expectations for supply tightness; apparently it all occurred so fast that the commercial grain business was too frozen to assess and re-position. As December corn rose 90c per bushel in reaction to widespread flooding east of the Mississippi River, and then, après deluge, abruptly fell back 75c, the December-March spread narrowed only a scant 2c and then reversed by as much. The result was a crummy month for us.

12 Questions to Ask Before Selecting a Commodity Trading Advisor
Here is a list that I’ve developed for Individual investors to know the answers to or ask before investing their risk capital with a Commodity Trading Advisor or Professional Money Manager. This checklist is ever evolving as new information comes to light or the dynamics change in the market place. Our hope in providing this […]
IASG May 2015 Performance Results
We have reached the end of June 2015 and compiled nearly 100% of the manager data for May 2014. With five months of performance on record, the IASG CTA Index has turned negative YTD (Past Performance not indicative of future results). We anticipate this trend will hold for the remainder of the month as investors focus now […]
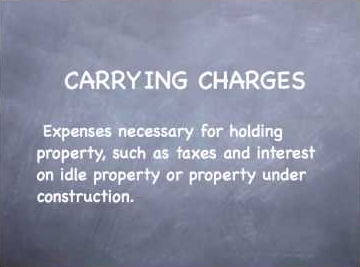
What are Carrying Charges and how do they influence hedging decisions?
In order to fully get the “error” in selling grain at harvest and then buying calls to replace that grain, so as to still participate in possible higher prices you need to understand how carrying charges work in the grain markets. The definition of “carrying charges” is: an expense or effective cost arising from unproductive […]

Advantages & Disadvantages of Call Options for Hedgers & Speculators
Buying (Long) a Call Option: A basic option strategy to be familiar with and learn the advantages and disadvantages of is buying a Call Option (Long Call). Buying a call option is the opposite of buying a put option in that buying a call gives you the right, but not the obligation, to buy the […]