

“If everything in your portfolio goes up and down at the same time, you have a bad portfolio.” This simple but powerful observation from Mark Rzepczynski, former CEO of John W. Henry & Company, is one I think of often – for both my customers and my own investing.
A losing position in your portfolio can be frustrating, but it can also be a sign that you structured your holdings properly. Traders build strategies to exploit specific market conditions, and those conditions constantly change. Any strategy that always goes up will eventually be blindsided – often badly.
A truly balanced set-up can lead to higher performance with less volatility. Understanding the drivers that make the most money within your risk tolerance over the long run is the key. Correlation is the secret sauce,
Myth 1: Negative correlation means one goes up when the other goes down
Many investors fear that a negatively correlated program will offset gains in other parts of the portfolio. While this may be true in some cases, buying puts to hedge long equity positions, for example, often oversimplifies the picture.
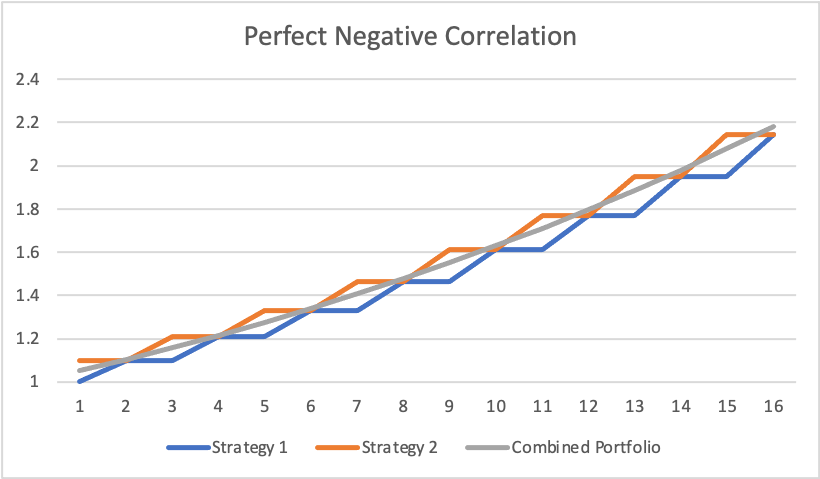
In the chart below, we show two programs with perfect negative correlation. When Strategy 1 increases by 10%, Strategy 2 remains flat at 0%. They flip each period, with one earning 0% and the other up 10%. When combined, they make a perfectly straight return line that yields 5% like clockwork. The correlation of the two programs is -1.0. Negative correlation doesn’t require one to lose money; it just requires returns to offset in timing.
Myth 2: Adding a single non-correlated asset diversifies the whole portfolio
Financial advisors often add a token alternative allocation so that when a crash occurs, they can point to the winning position. Many will forgo this choice altogether because explaining the losing position in the portfolio is more difficult than skipping it altogether. When a recession hits, they lose 30% of their clients but gain new ones from the other advisors who also bypassed diversification.
Weighting matters. Often, investors think of this in terms of dollars allocated to one bucket versus another. This simplifies the equation. A volatile, uncorrelated asset will create more of an impact than a sleepy one. It may be difficult to watch bigger swings at the asset level, but the portfolio level can be balanced. The CME suggests 20% of the portfolio, but as we will discuss in Myth 6, correlations vary over time. This percentage might be ideal for some periods or low for others. I find that balancing the dollar amount, the standard deviation of the alternative, and the amount of non-correlation for the addition can bring you to a logical number. Futures offer built-in leverage, making it easy to reach the desired target weight. Our blender tool can help you with this.
Myth 3: A higher Sharpe program will improve a portfolio more than a lower Sharpe option
Investors often choose options that look the best on a standalone basis. This leads to a focus on high Sharpe ratio programs with solid risk/reward characteristics. The benefit of this route is that, done correctly, the daily experience of the investment is easy. Few surprises come up, and stress levels stay contained. While it may be the best fit, a different alternative might fit the portfolio better. The behavior and the timing of the returns are often more important. Does the choice do well when others falter, or does it move the same as the rest of your portfolio? If it is the latter, you have added diversification for diversification’s sake.
Myth 4: Diversification is the same as non-correlation
The 60/40 portfolio stood as the basic standard of diversification for decades – until it wasn’t. Markets change. The rise of index funds coincides with the influx and withdrawals of massive sums of money that hit broad sectors simultaneously. This could cause a great company to lose big just because an unrelated firm posted poor earnings. Historical correlations between individual stocks and the S&P ranged from 0.3 in the 80s to sustained 0.4-0.65 levels since the 2000s. Recently, AI stocks have behaved differently from value stocks, which have fallen out of favor, slightly diluting this relationship.
Fixed income behavior is even more interesting, with small positive correlations with stock indices in the 80s and 90s, yielding a strong negative correlation in the subsequent two decades. Recently, diversification has all but disappeared, with numbers in the positive 0.6-0.8 range. This pushes investors to alternatives to find their non-correlation. This leads to our next myth.
Myth 5: All alternative investments add non-correlation
Most hedge funds promise downside protection, yet in practice, they have increasingly moved in lockstep with equities. Since the post “Dot com” bull market began, many managers adopted a persistent long bias, pushing average correlations from around 0.3 in the late 1990s to the early 2000s to 0.91 or higher in recent years. Private equity scores even higher on this metric.
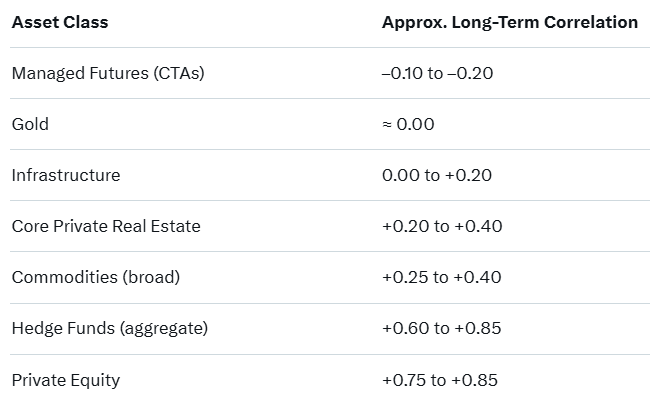
Managed futures stand out virtually by themselves as an asset class that maintains its low to negative correlation to the S&P 500. Using commodities, which already show a weak relationship, and then trading them long and short, yields one of the best diversifiers amongst all the alternatives. Crashing equities creates solid trends, which help them become one of the best shock absorbers for sustained losing periods. While not guaranteed in any environment, long-term data strongly support this pattern. Underperformance during bull markets might make them the “losing part” of the portfolio for longer periods, but also validates them as a key component of any portfolio construction.
Myth 6: Non-correlation is consistent
If something works every time, the true test is on its way. In the same vein, just because something usually happens does not mean it will all the time. Gold is often cited as a “safe-haven asset,” yet it is currently near all-time highs in conjunction with market records. This switch from risk on/risk off occurs frequently with negative correlation from 2000-2011, positive from 2013-2018, and then negative again from 2022-2023. Does this mean you should avoid gold? Of course not. You should, however, be aware of its nature and expect it to perform a role over long periods of time. Managed futures are known to be one of the most consistent performers in down markets, but they cannot hedge every shock. Their pattern demonstrates that they often do their best in challenging times.
Conclusion
Achieving true diversification is possible but requires patience and an understanding that something in your portfolio should always be losing. The best diversifiers – cash, long-duration bonds, trend-following, tail hedges – are often boring or painful to hold in bull markets. This is exactly how you know they are working.
Options exist that may underperform during rising markets but still get small wins or stay close to even. It may take only a few allocations at a sufficient weight to accomplish your goals. Managed futures might be the solution for you. Please reach out to your IASG representative if you would like to explore programs that may fit your needs.
Illustration created by ChatGPT (OpenAI / DALL·E)
Related Posts

Systematic vs. Discretionary Trading: Which Strategy Is Right for Your Portfolio?
Investors face many choices when selecting investments. Historically, the main divide was between fundamental and technical trading. The growth of computer systems for trading has introduced a potentially larger variable that will only increase as AI advances, whether in systematic (rules-based) or discretionary (human judgment) trading. In just my 20 years working in the industry, […]

Bowmoor Capital – A Different Approach to Trend Following
Competing head-to-head to outsmart others doing the same strategy is often a tough road. In trend following circles, giants like Man AHL, Winton, and Aspect dominate assets under management. This enables them to hire top PhDs, deploy better technology, test ideas rapidly, and outspend smaller players on sales and marketing. So how can a smaller […]

Auto Loans: The Overlooked Credit Canary
Identifying weakness in markets can be a difficult task. Metrics like gross domestic product (GDP), equity market gains, and unemployment paint in broad strokes. Lenders often try to identify risk at a granular level. This might include tracking payments arriving late, higher credit card balances, increases in line of credit usage, or non-payment of insurance […]