Category: CTA

Bowmoor Capital – A Different Approach to Trend Following
Competing head-to-head to outsmart others doing the same strategy is often a tough road. In trend following circles, giants like Man AHL, Winton, and Aspect dominate assets under management. This enables them to hire top PhDs, deploy better technology, test ideas rapidly, and outspend smaller players on sales and marketing. So how can a smaller […]

AG Capital – Volatility Expansions and Contractions
We had an interesting conversation with an extremely sophisticated allocator recently. He asked, given that you have had a good run with a long gold position this year, with large open profits, how much will you lose if it reverses hard and you are stopped out at lower levels?”. It’s a question that gets to the heart of trading, and ultimately deals with the difference between what’s known as open equity and closed equity.

Warrington Asset Management – Looking back on July
The S&P 500 continued to climb steadily up to the last trading day of the month even though market participants knew that day could bring volatility, as the U.S. Federal Reserve (the “Fed”) was scheduled to announce their latest monetary policy update on July 31st. Speculation about their intentions to lower interest rates for the first time in ten years had been a market focus for months. Fed Funds futures pricing is often used to estimate the probability of pending Fed interest rate changes, and had signaled the most likely decrease to be between 25 and 50 basis points. However, when Charmain Powell announced the 25 basis point cut he also implied it might be a “one and done” scenario rather than a prolonged rate cutting cycle favored by market participants, causing an immediate decline in stock prices. The selling in the S&P was strong, sending the Index to its largest intraday decline since early May. In fact, prior to that drop, the S&P had not had a 1% daily gain or loss in the previous 36 consecutive trading days, the longest streak since early October 2018.
Explaining Hedge Fund Performance: Market Risk vs. Style Performance
Hedge fund performance was dominated by the exposure to market risk as those fundamental equity funds that held more market risk dominated style performance. However, the average returns mask the large dispersion across styles. We still use indices for analysis because it does provide some information on what the average investor may expect. For example, while CTAs were down, on average, for the first quarter, anecdotal evidence from managers sending me reports show some up in the double digits for the first quarter. Winners made big money in the last quarter.
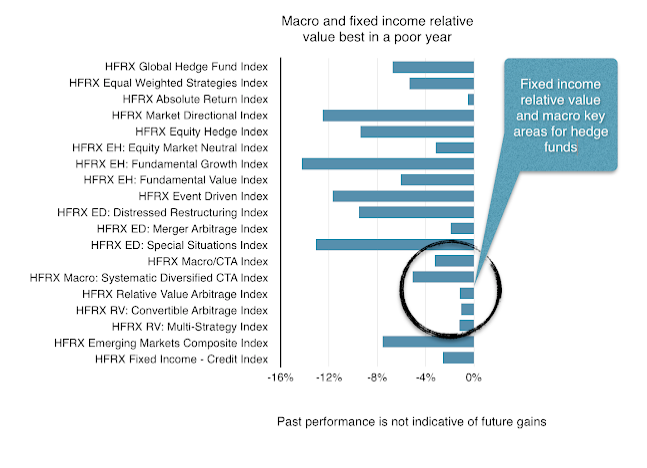
Hedge fund performance – Not great for those looking for absolute performance
The only hedge fund sectors that made significant returns in December were global macro and systematic CTAs. These are the divergence strategies that are supposed to generate returns when there are market dislocations. Macro and systematic managers, through casting a wide net across asset classes and going both long and short, should find opportunities when there are significant dislocations. The remaining hedge fund strategies lost money, but significantly less than the exposure to market beta. It was not a successful month for most hedge funds, but it was not as bad as exposure to equity beta. However, long duration Treasuries proved to be a better hedge.
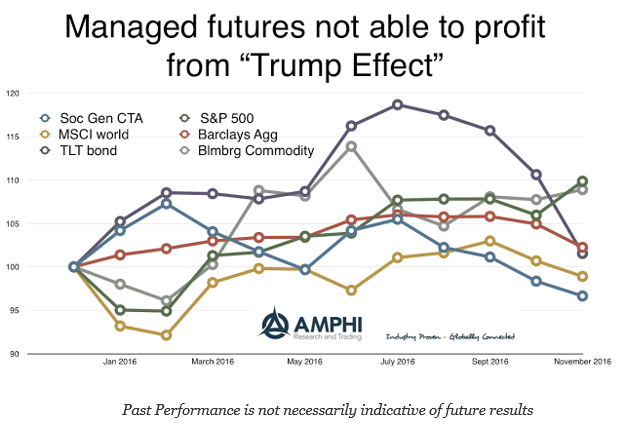
CTA Performance – On Average, Could Not Take Advantage of “Trump Effect”
A large sell-offs in bonds both domestically and around the world, a strong US equity move, and a strong dollar trend that changed perceptions on currencies, did not create an environment where managed futures were able to generate positive returns. I don’t want to be accused of hindsight bias, but a review of price trends in bonds and the dollar going into the election suggested that post-election moves, while extended, were not inconsistent with longer-term trends. Still, an early review suggests that there have been some major winners in this space who will end the year with strong positive gains. Careful CTA manager selection has meant the difference between success and failure in 2016.

The Failures of Central Banking
We have been meaning to write an in depth report on central bank policies for some time and the market responses to recent BoJ policy decisions as well as the Fed meeting and press conference this week have nudged us to make a start. Below are some initial thoughts on how good central banks are in their forecasts and where they may take us in the future. We don’t mean this to be a rant, but it’s hard to discuss central banking politely when they have been so ineffective, when they refuse to accept they have been incorrect and they refuse to fully acknowledge the full unintended consequences of their hugely experimental policies.
Kottke Commodities – A Half-Empty or Half-Full Glass?
We know of very few commercial entities or traders that were positioned last month to reflect much possibility that soybean prices at CME might be far too low. Plenty of different explanations have been offered as to the source of last month’s abrupt price explosion of grains and oilseeds prices. These can be roughly divided into two groups, “game theorists” and “statistical analysts.”
CTA Spotlight – Sandpiper Asset Management
Today we are profiling a CTA that is new to the IASG database: Sandpiper Asset Management. The Sandpiper Global Macro Program is a multi-strategy program employing systematic trend following and discretionary trading methods across 50 liquid futures markets. The Program produces returns across a wide range of economic cycles and exhibits a negligible correlation to other investable assets. Risk is managed […]
Cattle: Futures Commentary
Bulls had something to cheer about to finish off last week’s trading in the Cattle markets after Thursday’s limit higher move followed by a $2-3 rally on Friday. However, the Friday afternoon USDA news was somewhat of a letdown, with the choice beef cutout coming in off $3.02 and the monthly COF (Cattle on Feed) […]
Crude Oil: Potential Target in Focus
Crude oil bulls had a brilliant day on Thursday, with the oil complex posting strong gains. Brent crude finished at $64.83while WTI closed at $57.66. With the market sailing above the 100-day MA last week, a review of the continuation chart gives a perspective on what the bulls might be targeting in the longer term. […]
Avoiding Costly Mistakes in CTA Trading: Key to Consistent Profits
Success in trading is measured in terms of the growth of the account balance. A CTA is not expected to play God and call every twist and turn in the market correctly. Some professional and proven CTA systems are only correct 25-30% of the time and still consistently pull huge profits out of the markets. […]
CTA Badges and Rankings
CTAs are always looking for opportunities to provide their firms additional exposure. Since IASG compiles data within our database, we thought it was relevant to provide CTAs with more marketing power when trying to reach their investing audience. Starting later this month, IASG will provide CTAs with access to a badge for ranking in the categories that meet their trading program. These categories include: discretionary, systematic, agriculture, Trend Following, Stock Index. The rankings badges will be provide monthly to the CTA for using on their email signature, embedding in their website, or within their marketing literature. Users of the IASG database will also get access to these badges on the CTA pages located in the right sidebar of the program page.